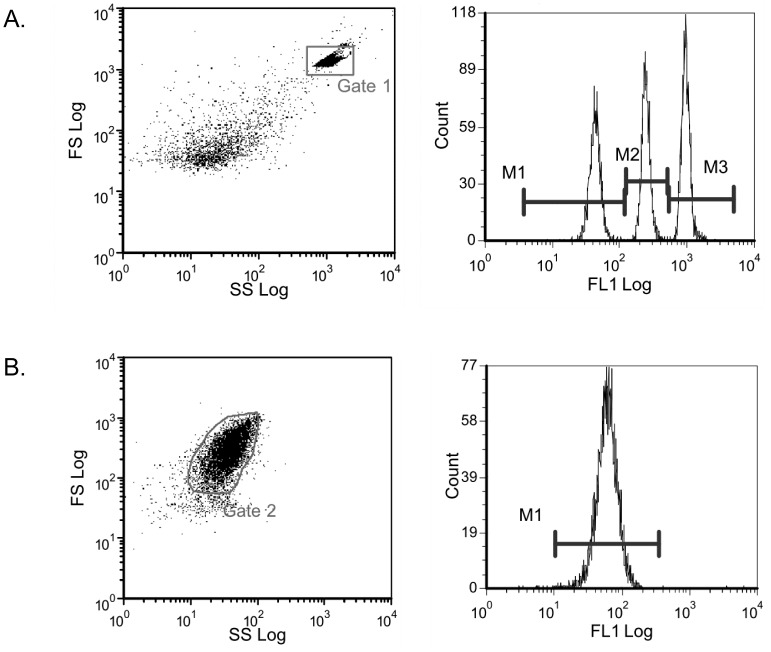
Figure 1. Test calibration cytogram with cursor settings in gated fluorescence histogram (a) and platelet rich plasma cytogram with GpIa immune-labelling cursor settings (b).
A single color flow cytometric analysis of the platelet glycoproteins GpIa, GpIb and GpIIIa was used (Biocytex, Marseille, France). The number of antigenic sites is determined by converting the fluorescence intensity into the corresponding number of sites per platelet based on calibrated bead standards (a). In all experiments, more than 90% of the platelets of the PRP were gated for the experiment, as shown here for GpIa (b).

