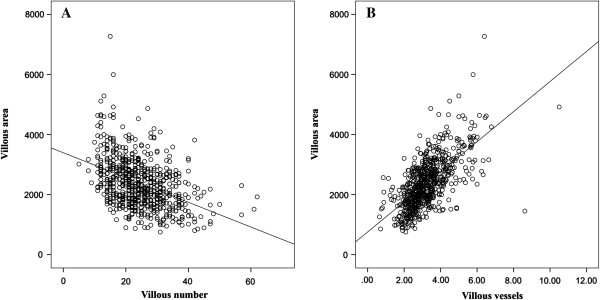
Figure 3.

Correlations between the villous area, number of villi per high-powered field and villous vascularity. 3 A – Dot plot showing the negative correlation between the villous area and observed number of villi per hpf in individual cases (Line = line of best fit, Spearman rank correlation coefficient rho = −0.425, p <0.0001). 3 B – Dot plot showing the positive correlation between the villous area and villous vascularity in individual cases (Line = line of best fit, Spearman rho = 0.668, p <0.0001).
