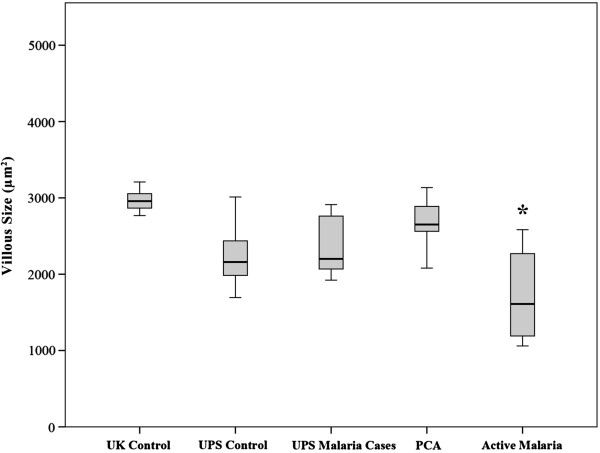
Figure 4.
Boxplot graph comparing villous area between clinical groups of controls and cases derived from different fixative methods or geographical origin. A boxplot showing the distribution of villous area in sq μm between groups including UK controls, UPS cases (Thai/Karen cases fixed with formalin, divided into control non-malaria infected and malaria -infected UPS cases), PCA cases (Thai/Karen cases fixed with Streck fixative), and active placental malaria cases (Thai/Karen cases also fixed with formalin). UK controls showed significantly higher villous area than other groups (p <0.0004). PCA cases showed a non-significantly higher villous area than UPS controls fixed in formalin (p <0.0842). Active placental malaria cases showed significantly lower villous areas than all other groups *. Box and whisker plots for this and subsequent figures include; line = median, upper and lower bar = 25 and 75th centiles, respectively, with shaded box covering interquartile range; whiskers cover maximum and minimum values.

