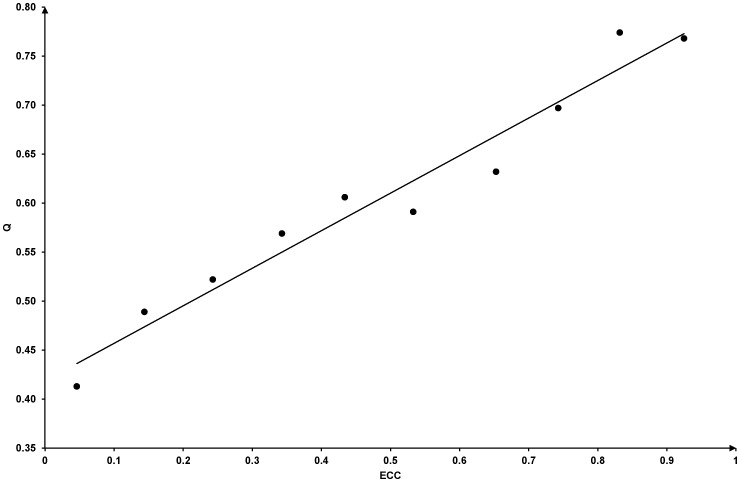
Figure 2. The relationship between ECC and co-localization scores.
For every pair of interacting proteins with experimentally annotated subcellular locations, the ECC of their interactions and the co-localization score were computed. These interactions were divided into ten groups according to their ECC values. The first group contained the interactions with ECC value between 0 and 0.1.The second group contained the interactions with ECC value between 0.1 and 0.2. The third group contained the interactions with ECC value between 0.2 and 0.3, and so forth. The average values of ECC and co-localization score were computed for every group. The horizontal axis of this figure is the average value of ECC. The vertical axis of this figure is the average value of co-localization score. Ten dots were plotted on this figure to represent the ten groups of interactions. A straight line was generated using simple linear regression method to represent the linear relationship between the average ECC and the average co-localization score.

