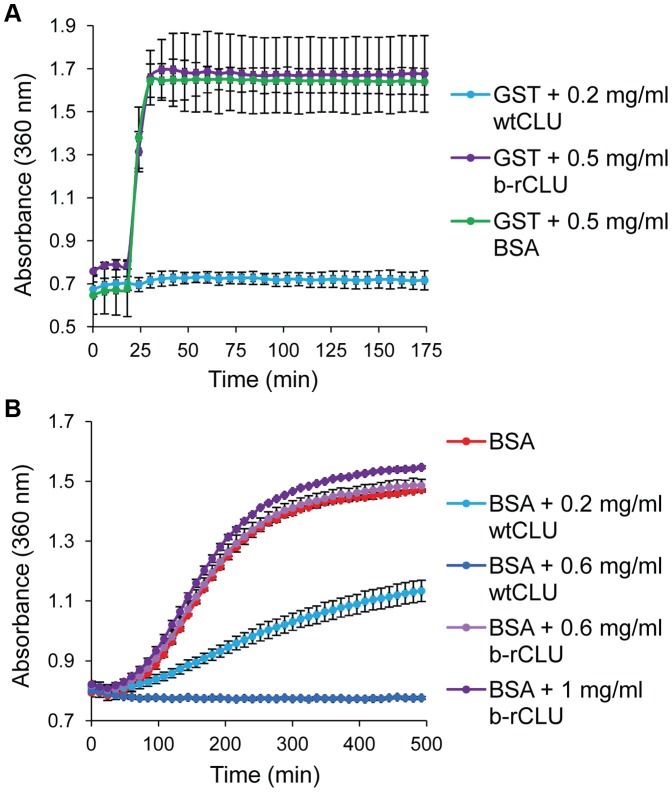
Figure 3. Chaperone assays for b-rCLU and wtCLU using 2 client proteins.
(A) GST was heated at 60°C; BSA (negative control protein), wtCLU (positive control) and b-rCLU were tested at the concentrations indicated. The A360 is plotted at 6 min intervals (mean ± standard deviation; n = 3). (B) BSA (1.5 mg/ml) was reduced with 20 mM DTT; wtCLU (positive control) and b-rCLU were tested at the concentrations indicated. The A360 is plotted at 12 min intervals (mean ± ½ range; n = 2).

