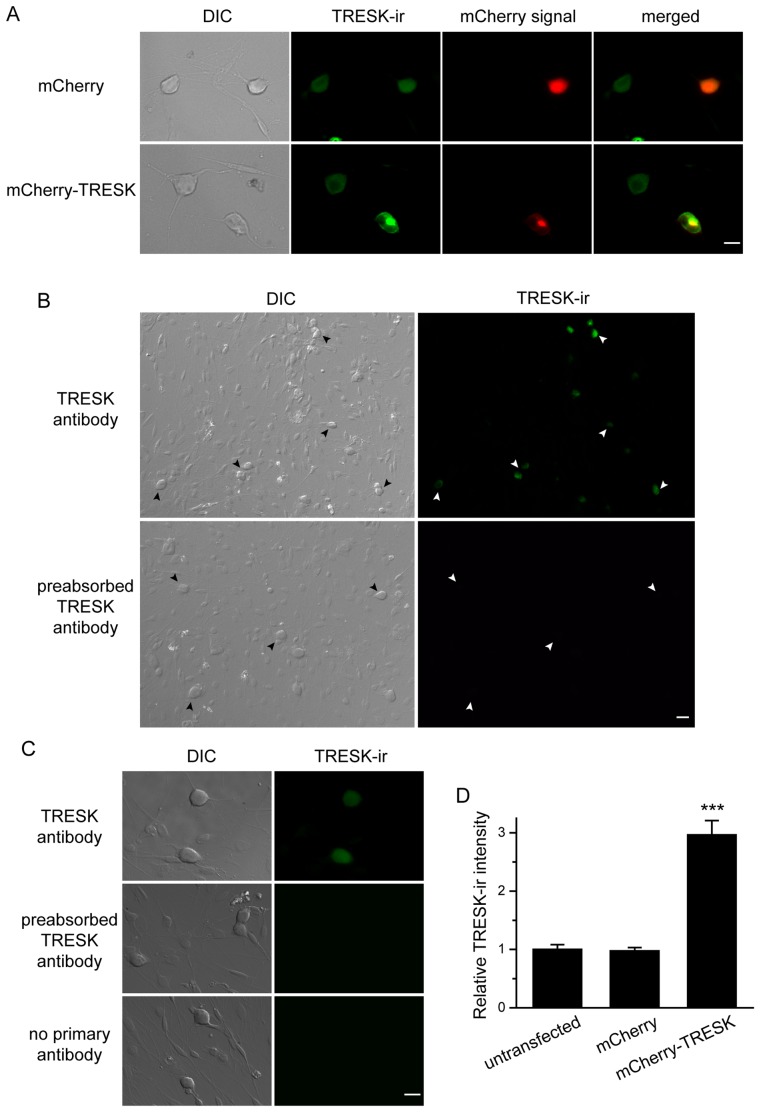
Figure 2. Over-expression of mCherry-TRESK subunits in cultured TG neurons.
A, Representative images of cultured TG neurons expressing mCherry and mCherry-TRESK, respectively. Neurons were stained with a TRESK antibody two days post-transfection. The TRESK antibody recognizes both endogenous and over-expressed TRESK subunits. Scale bar = 10 µm. B, Low-magnification representative images of cultured TG neurons stained with the TRESK antibody (upper panel) and the same antibody pre-absorbed with antigen at 1∶10 molar ratio (lower panel). The arrowheads indicate TRESK-ir of TG neurons in the culture. Scale bar = 20 µm. C, High-magnification representative images of cultured TG neurons stained with the TRESK antibody (upper panel) and the same antibody pre-absorbed with antigen at 1∶10 molar ratio (middle panel). Lower panel shows TG neurons stained with the secondary antibody only. Scale bar = 10 µm. D, Relative TRESK-ir intensity in untransfected TG neurons, neurons expressing mCherry and mCherry-TRESK, respectively (*** p<0.001, one way ANOVA with post hoc Bonferroni test, compared with the untransfected group, n = 99, 32 and 25 cells in each group, respectively).

