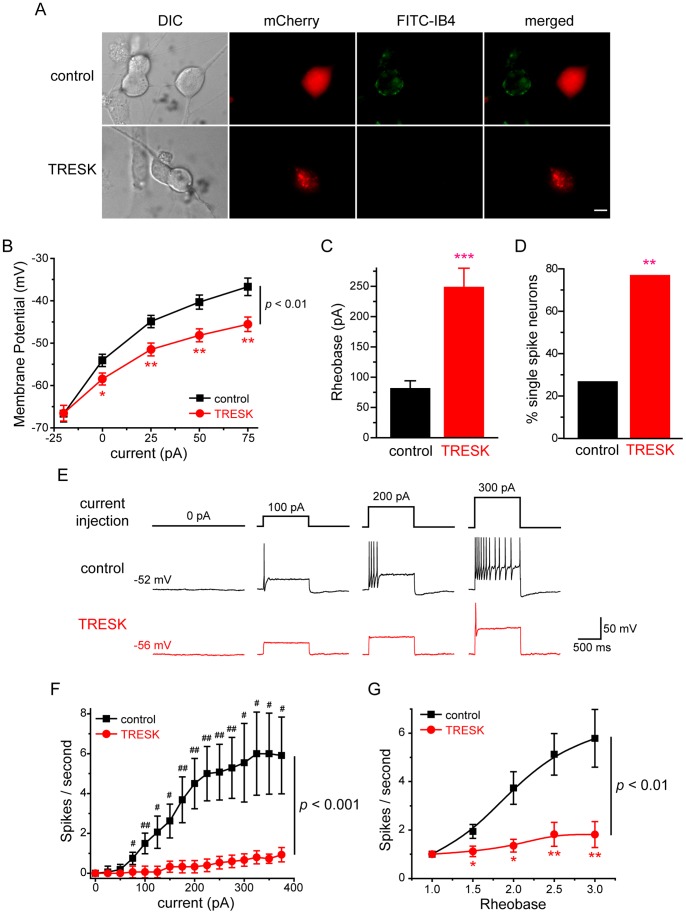
Figure 4. Over-expression of TRESK channels reduces the excitability of small IB4-negative TG neurons.
A, Representative images of the transfected TG neurons stained with FITC-IB4. TG neurons in the control and TRESK groups were transfected with plasmids encoding mCherry protein and mCherry-TRESK subunit, respectively. Scale bar = 10 µm. B, Steady-state membrane potential in response to incremental current injections in transfected, small IB4-negative TG neurons (* p<0.05, ** p<0.01 between the corresponding control and TRESK groups, two-way RM ANOVA and post hoc t-test with Bonferroni correction; n = 19 and 17 neurons in the control and TREK groups, respectively). C, Mean rheobase of the small IB4-negative TG neurons expressing mCherry proteins and mCherry-TRESK subunits (*** p<0.001, two-tailed t-test, same neurons as in B). D, The percentage of single-spike neurons in the control and TRESK groups (* p<0.01, Fisher’s exact test, same neurons as in B). E, Representative traces of APs generated by incremental depolarizing current injections in transfected, small IB4-negative TG neurons. The values of Vrest and injected current are indicated. F, The input-output plot of transfected, small IB4-negative TG neurons in the control group is significantly different from that in the TRESK group (same neurons as in B, p<0.001, two-way RM ANOVA). The spike frequency was measured by injection of 1 sec depolarizing current in 25 pA incremental steps in each neuron (# p<0.05, ## p<0.01, two-tailed t-test between the corresponding control and TRESK groups). G, The input-output plots of the spike frequency in response to 1 sec depolarizing current injection from 1- to 3-fold rheobase in transfected, small IB4-negative TG neurons (* p<0.05, ** p<0.01 between the corresponding control and TRESK groups, two-way RM ANOVA and post hoc t-test with Bonferroni correction; same neurons as in B).

