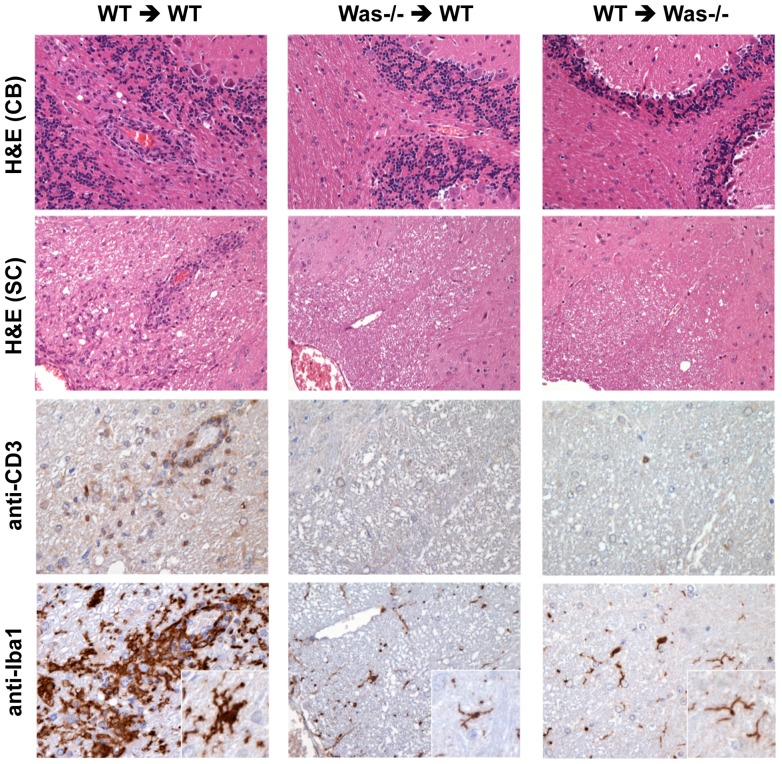
Figure 3. Histological features of brain and spinal cord sections from passively induced EAE (WT in WT, WT in Was−/− and Was−/− in WT).
Samples were obtained 3 weeks after transfer and stained with H&E (upper panels; CB, cerebellum and SC, spinal cords), anti-CD3 and anti-Iba1 (lower panels). Insets show in detail representative microglial cells within spinal cords. Upper panels are from 10×, lower panels from 20× and insets from 40× original magnification.

