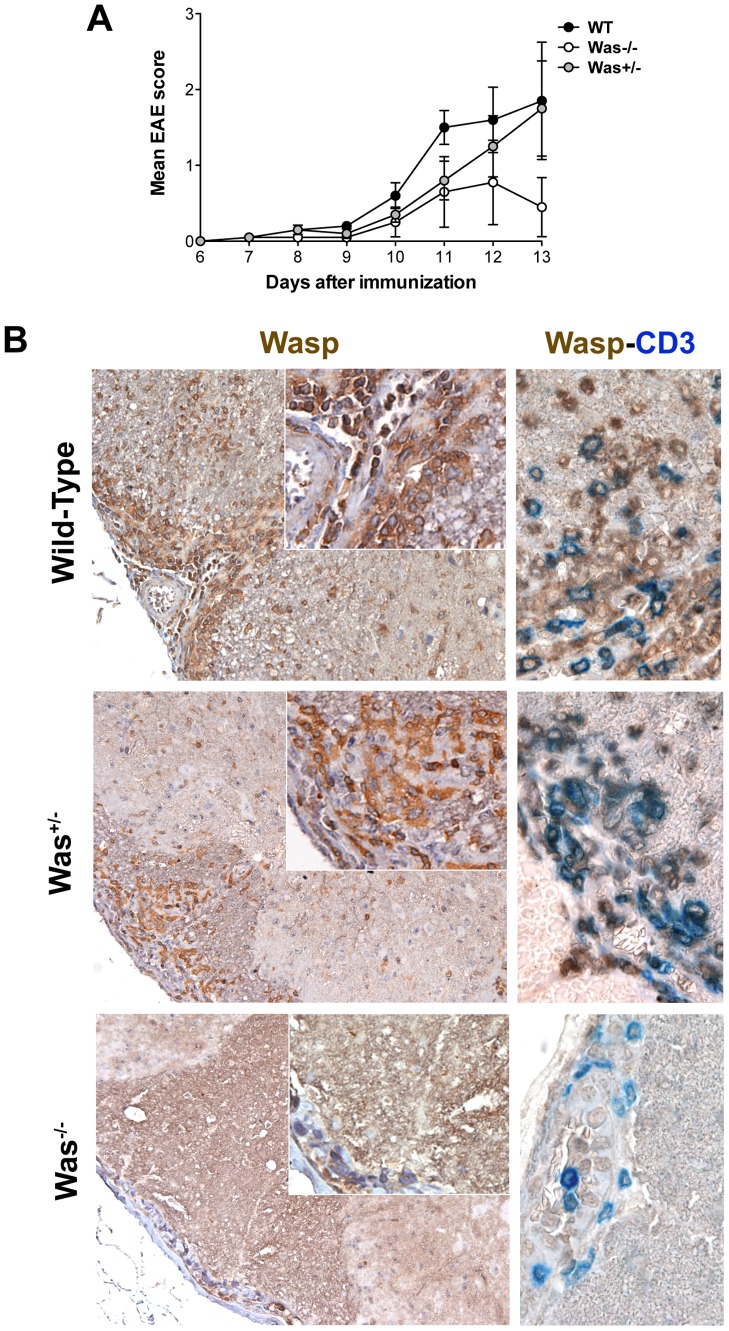
Figure 4. Was+/− heterozygous mice are not resistant to EAE induction.
A, EAE was induced in Was−/− (white circles), Was+/− (grey circles) and WT mice (black circles) with MOG35–55 peptide. Data represent mean clinical scores of 5 mice/group ± SEM. B, Histopathological analyses were performed on spinal cords obtained from Was−/−, Was+/− and WT mice 14 days after the induction of EAE. WASP (left panels) and WASP-CD3 (right panels) immunostains highlight WASP expression in total CNS infiltrates and in T-cell infiltrates, respectively. Details of the staining are reported in the insets. In all panels serial sections of representative CNS samples are reported. Panels for WASP single stainings are 20×, insets 40× and WASP-CD3 double stainings 60× original magnification.

