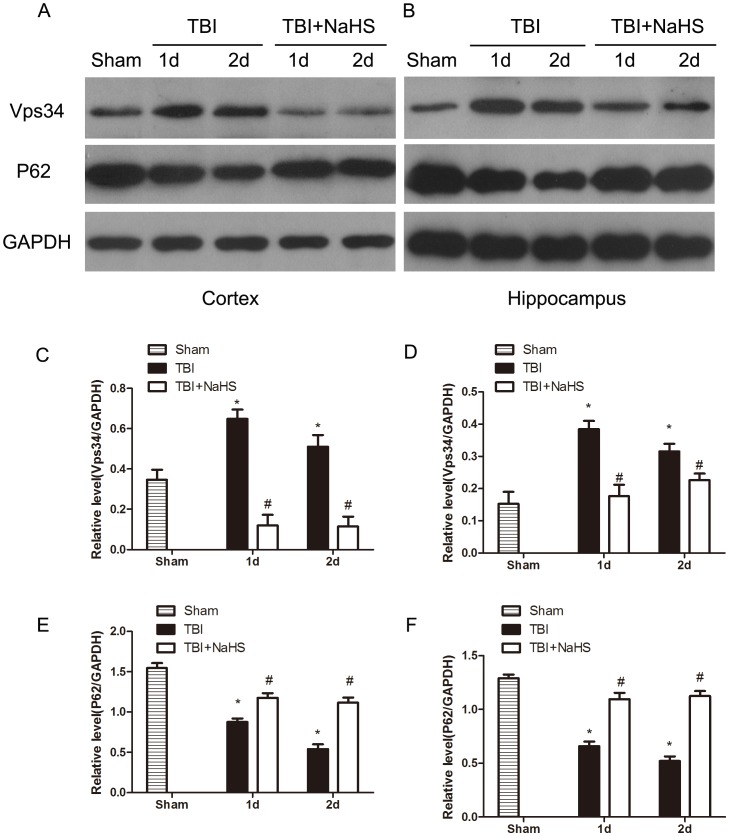
Figure 5. H2S pretreatment suppressed TBI-induced the increase of Vps34 and P62.
Sample immunoblots probed for Vps34, P62 and GAPDH are showed above. The bar chart below demonstrates the ratio of Vps34 and P62 relative to GAPDH. TBI-induced up-regulation of Vps34 and down-regulation of P62 were inhibited by H2S in the cortex (A) and hippocampus (B). Optical densities of the protein bands were quantitatively analyzed with Sigma Scan Pro 5 and normalized with loading control GAPDH. Semiquantitative analysis (relative optical density) of the intensity of staining of Vps34 to GAPDH in the cortex (C) and hippocampus (D). Semiquantitative analysis (relative optical density) of the intensity of staining of P62 to GAPDH in the cortex (E) and hippocampus (F). The data are means ± SEM (n = 3, *P<0.05, TBI group vs. sham group; # P<0.05 TBI+NaHS group vs. TBI group at the same time point).

