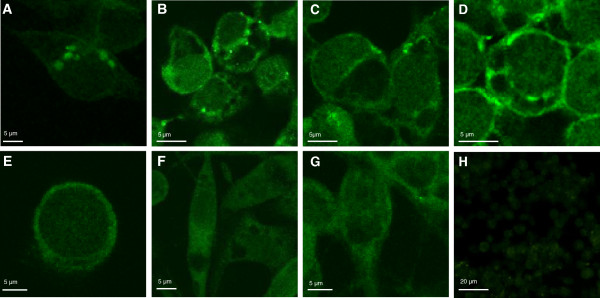
Figure 2.

Immunofluorescence analysis of tick cells. Representative images of imunofluorescence analysis of tick cells. Tick cells were stained with rabbit anti-tick protein antibodies (green, FITC). (A, B) BME/CTVM2 cells stained with anti-SILK antibodies. (C, D) BME/CTVM2 cells stained with anti-TROSPA antibodies. (E) BME/CTVM2 cells stained with anti-SUB antibodies. (F) IDE8 cells stained with anti-SUB antibodies. (G) ISE6 cells stained with anti-SUB antibodies. (H) preimmune control serum-treated BME/CTVM2 cells. Scale bars, 5 μm (A-G); 20 μm (H).
