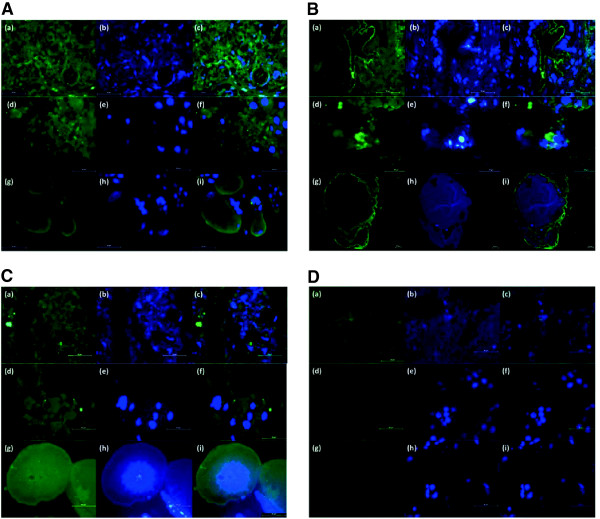
Figure 3.
Immunofluorescence analysis of tick tissues. Representative images of imunofluorescence analysis of R. microplus engorged female tick tissues. Tick salivary gland (a-c), gut (d-f) and ovary (g-i) tissue sections were stained with rabbit anti-tick protein antibodies (green, Alexa Green 488; (a, d, g)) and DNA was stained with DAPI (blue; (b, e, h)). Merged images are also shown (c, f, i). (A) Tick tissue sections were stained with anti-SILK antibodies. (B) Tick tissue sections were stained with anti-TROSPA antibodies. (C) Tick tissue sections were stained with anti-SUB antibodies. (D) Tick tissue sections were stained with preimmune control serum. Scale bars, 50 μm.

