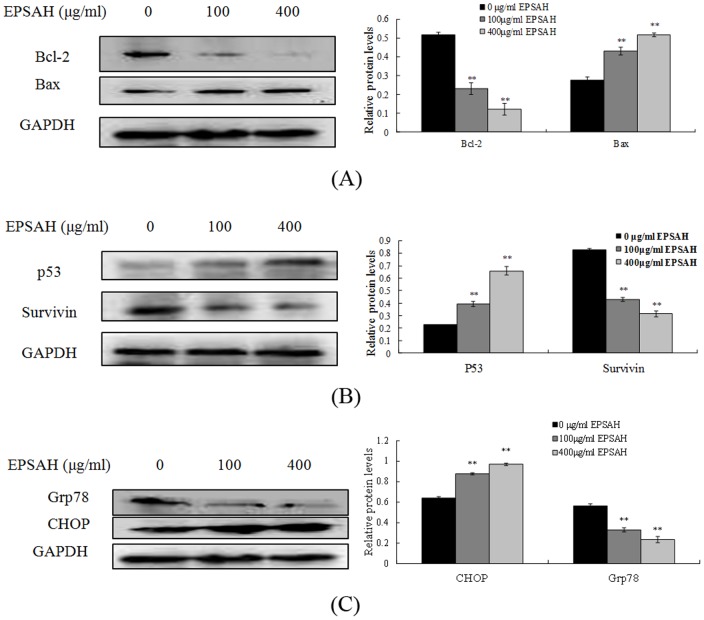
Figure 7. EPSAH induced Bcl-2, Bax, P53, survivin, Grp78 and CHOP protein expression levels in HeLa cells.
Cells were treated with EPSAH at the concentrations of 100 and 400 µg/ml for 48 h. The treated and untreated cells were lysed and cell extract subjected to western blots with the antibodies as described in the Methods section. Immunoblot images are the representative of 3 identical experiments. The GAPDH blot is a loading control. (A) Bax/Bcl-2 proteins, (B) P53 and survivin proteins (C) Grp78/CHOP proteins.

