
Figure 3.
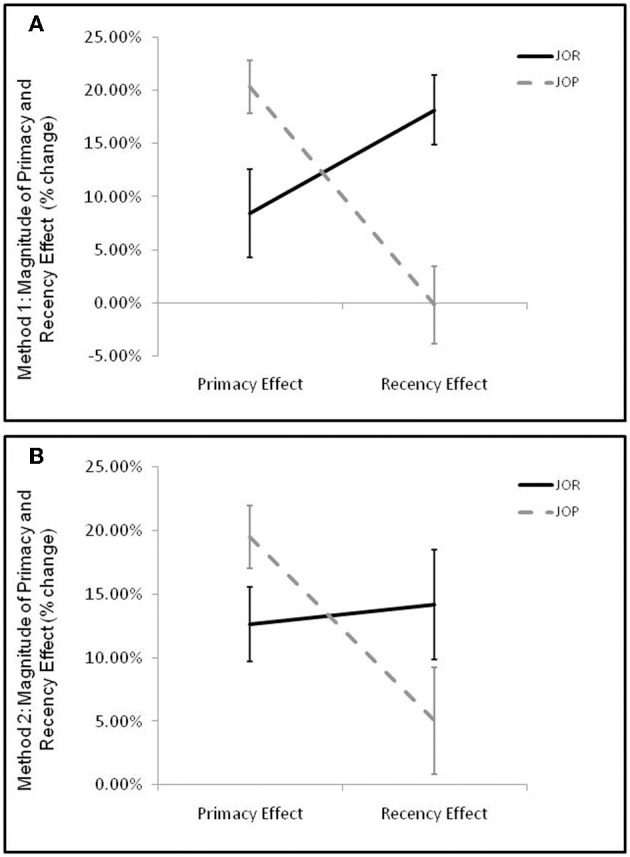
Average magnitude of primacy and recency effects in JOR and JOP. Error bars represent the standard error of the mean. Calculation of primacy and recency effects produces an index of the percent reaction time advantage for retrieval of the primacy/recency item when compared to retrieval of middle items. (A) Primacy and recency effects in JOR and JOP calculated using method 1. Method 1 divides trials by the serial position of the correct probe item, and primacy and recency trials were defined by whether the earliest or latest possible correct response was the correct answer in the probe. (B) Primacy and recency effects in JOR and JOP calculated using method 2. Here, trials are divided by considering both items in the probe, and primacy and recency item trials are trials that include the earliest (primacy) or latest (recency) item.