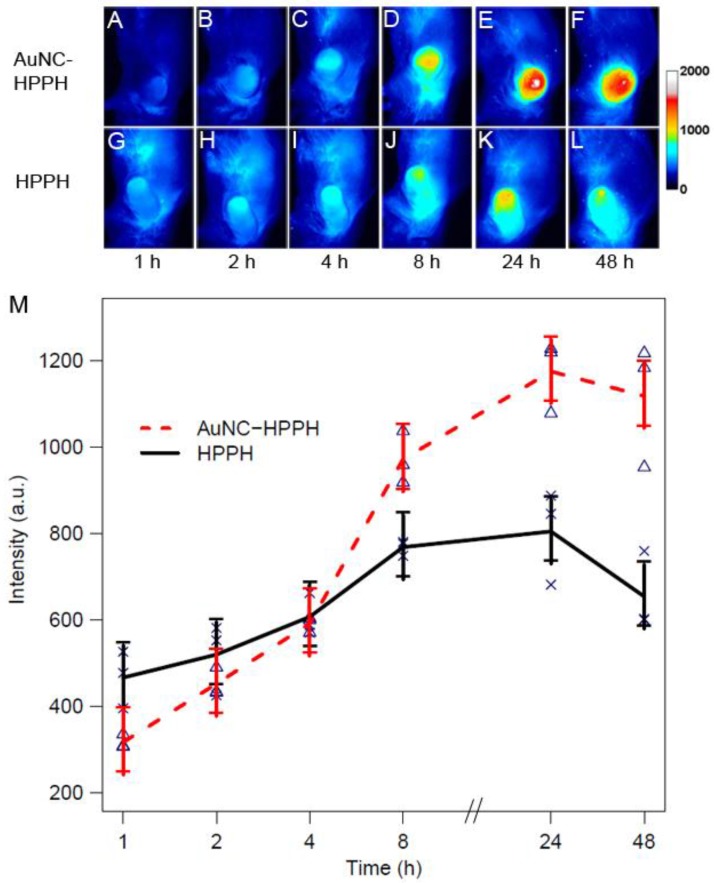
Figure 4.
In vivo whole body fluorescence images of Colon-26 tumor-bearing mice acquired after intravenous injection of 0.3 µmol/kg of HPPH as AuNC-HPPH (A-F) and HPPH (G-L). (M) Plot of fluorescence intensity of the tumor region as a function of time for two groups of mice (3 mice per group) intravenously administered with AuNC-HPPH (red) and HPPH (black). The mean values and the standard errors were obtained by fitting the raw data using a linear model (p < 0.05). The measurements at each time point were labeled for AuNC-HPPH (triangles) and HPPH (crosses).

