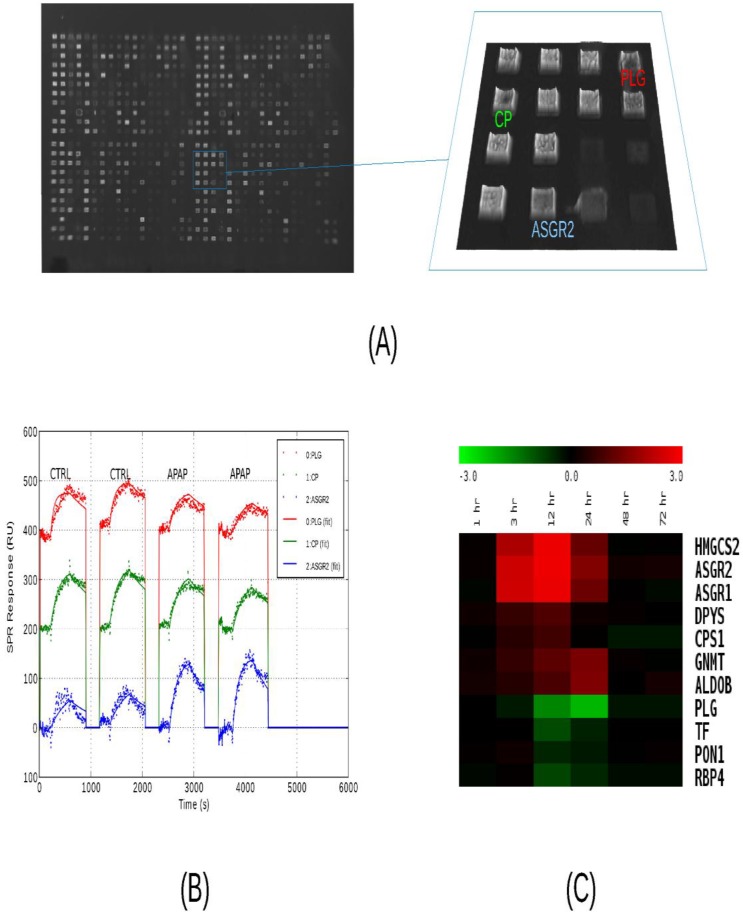
Figure 2.
Analysis of serum protein levels by SPRI. (A) Raw SPR image of a 792-feature microarray under PBS buffer. The features consist of 384 antibodies and 12 buffer blanks printed in duplicate over a 2 cm2 area. Antibodies were diluted to 0.2 - 0.5 mg/mL for printing. A 1.6 mm2 area containing antibodies to liver-specific proteins is highlighted in blue. (B) Sensorgrams from three features subject to four sample injections. Two injections of control plasma (C24) are followed by two injections of high-dosage APAP-treatment plasma (A24). The samples were pooled plasma, collected from three mice, 24 hours after treatment and diluted 1:63 in running buffer. The injections consist of five minutes of binding, five minute of washing, and two minutes of regeneration. Recorded data is plotted with dotted lines and model-fitted data is plotted with solid lines. Plasminogen (PLG, red) levels decrease while ASGR2 (blue) levels increase, relative to ceruloplasmin (CP, green). (C) Relative serum protein profiles from 1 to 72 hours after APAP-treatment as determined by SPRI. Pooled samples were analyzed using a 50-feature SPRI microarray. Sensorgrams were recorded and model parameters (on-rate, off-rate, and concentration) were determined by curve-fitting. A number of protein levels are observed to rise between 3 and 24 hours, while normally-abundant serum proteins such as plasminogen (PLG), transferrin (TF), paraoxonase 1 (PON1), and retinol-binding protein 4 (RBP4) decrease between 12 and 24 hours, post-treatment. Heat map colors indicated log2 ratios relative to the zero-hour control sample..

