Figure 2.

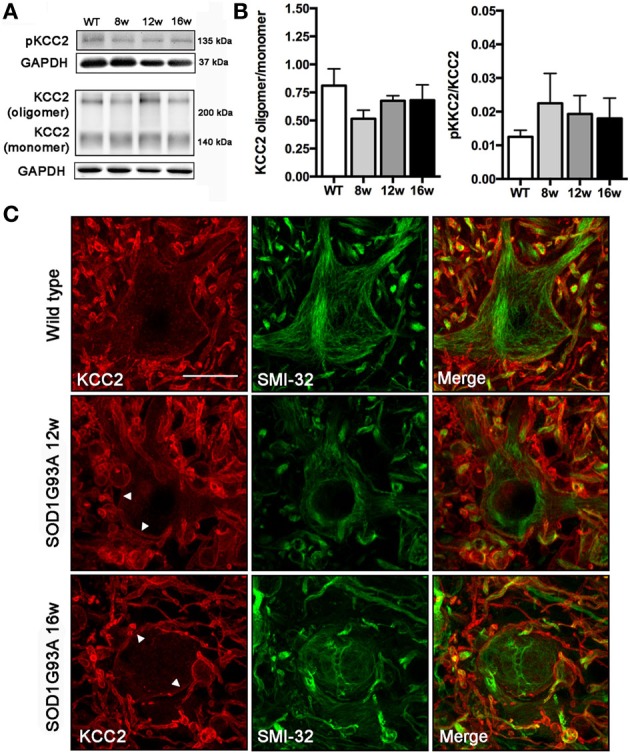
Analysis of KCC2 and phopho-KCC2 expression in the ventral spinal cord of SOD1G93A mice at 8, 12, and 16 weeks of age. (A) Representative blots of phopho-KCC2 and total KCC2 (on both monomeric and oligomeric states). (B) KCC2 western blots quantifications. Graphs represent the ratio between the oligomeric KCC2 (functional state) vs. monomeric KCC2 and the phopho-KCC2 (active form) vs. monomeric KCC2. Note the lack of significant differences between SOD1G93A at any age and wild type littermates. Data are represented as mean ± s.e.m. (C) Confocal images of wild type and SOD1G93A L4 spinal MNs confirmed the maintenance of membrane-bound (active) KCC2 in transgenic animals along disease progression, even in abnormal MNs at 16 weeks of age. Arrowheads show the membrane bound KCC2 in SOD1G93A L4 spinal MNs. Scale bar 20 μm.
