
Figure 1.
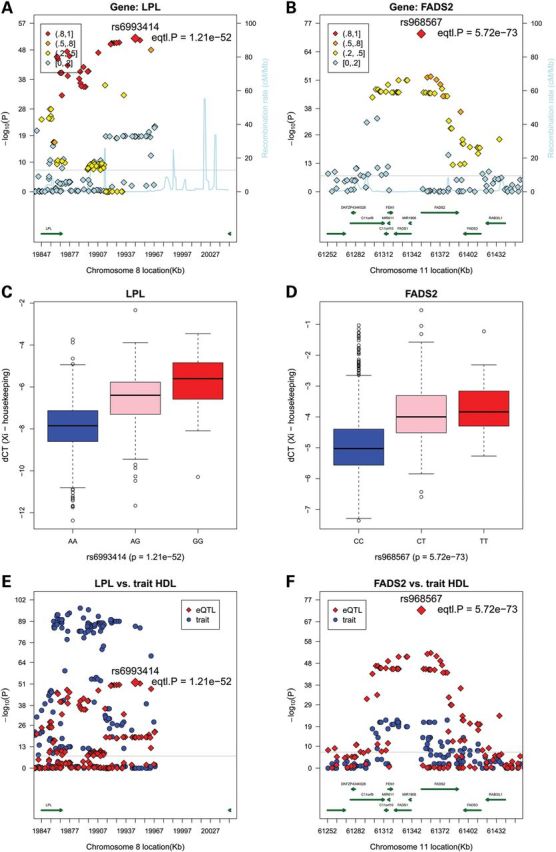
Regional plots and box plots for gene LPL and FADS2 top cis-SNPs whose signals were attenuated markedly after adjusting for the lead GWAS SNPs. Top panel: observed –log10(P) and recombination rates by chromosomal position for all associated SNPs near rs6993414 near LPL on chromosome 8 (A) and rs968567 near FADS2 on chromosome 11 (B). Association plots were conducted with the use of R. Top SNP of interest and P-values in each region are indicated (red diamonds). Color coding indicates the strength of LD of each SNP with the top SNP in each region (measured by r2). The light blue line represents the estimated recombination rates. Gene annotations are shown as dark green lines. Middle panel: linear regression analysis of normalized log transformed ΔCT expression values (ΔCT =CTgene − mean CT3 housekeeping genes) for gene LPL with genotypes of SNP rs6993414, giving a P-value of 1.21 × 10−52 and beta-coefficient of −1.83 (C), and for gene FADS2 with genotypes of SNP rs968567, giving a P-value of 5.72 × 10−73 and β-coefficient of −1.53 (D). Bottom panel: regional plots for eQTL associations (red triangles) and GWAS clinical traits associations (blue circles). Colors indicate LD with the peak eSNPs (red diamonds). LPL cis-associations versus. GWAS HDL results (E), and FADS2 cis-associations versus. GWAS HDL results (F).