
Figure 2.
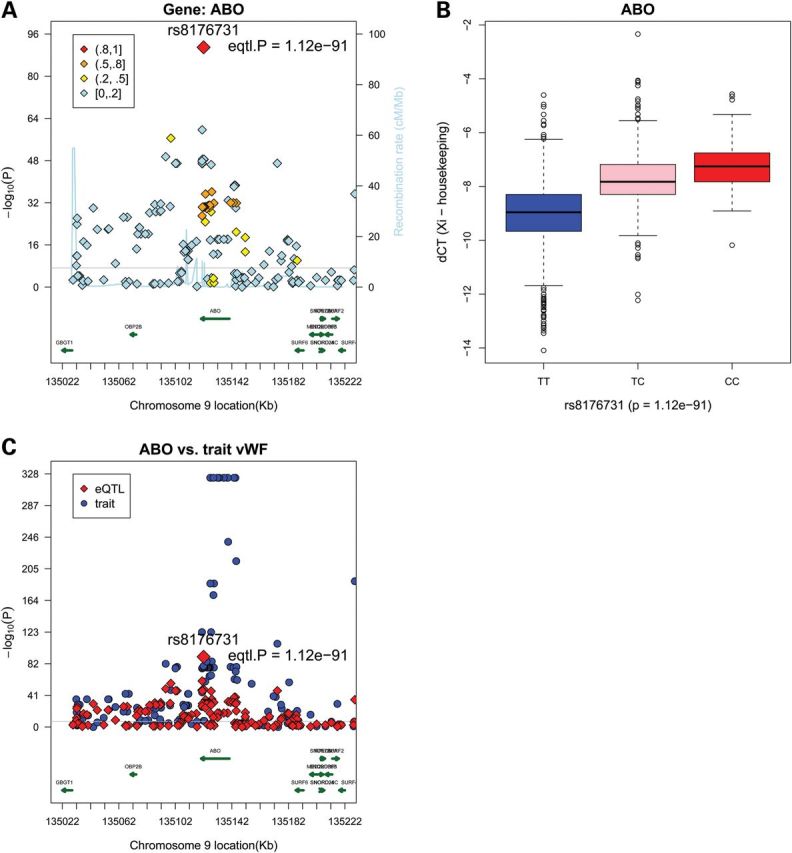
Regional plots and box plots for gene ABO top cis-SNPs whose signal was not attenuated after adjusting for the lead GWAS SNPs. (A) Observed −log10(P) and recombination rates by chromosomal position for all associated SNPs near rs8176731 near ABO on chromosome 9. Top SNP of interest and P-values in each region are indicated (red diamonds). Color coding indicates the strength of LD of each SNP with the top SNP in each region (measured by r2). The light blue line represents the estimated recombination rates. Gene annotations are shown as dark green lines. (B) Linear regression analysis of normalized log transformed ΔCT expression values (ΔCT = CTgene − mean CT3 housekeeping genes) for gene ABO with genotypes of SNP rs8176731, giving a P-value of 1.12 × 10−91 and β-coefficient of −1.43. (C) ABO cis-associations versus. GWAS vWF results. Regional plots for eQTL associations (red triangles) and GWAS clinical traits associations (blue circles). Colors indicate LD with the peak eSNPs (red diamonds).