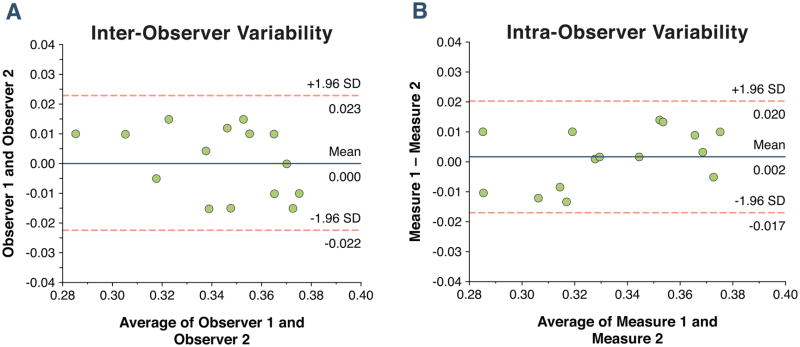
Figure 3. Bland-Altman plots showing the 95% limits of agreement between two observers (A) and within a single observer (B) for 15 randomly selected patients with hypertension.

The mean percentage difference between observers was 5.9% with a standard deviation of the absolute difference of 0.02. The mean percentage intra-observer variability was 4.8% with an absolute standard deviation of 0.015.
