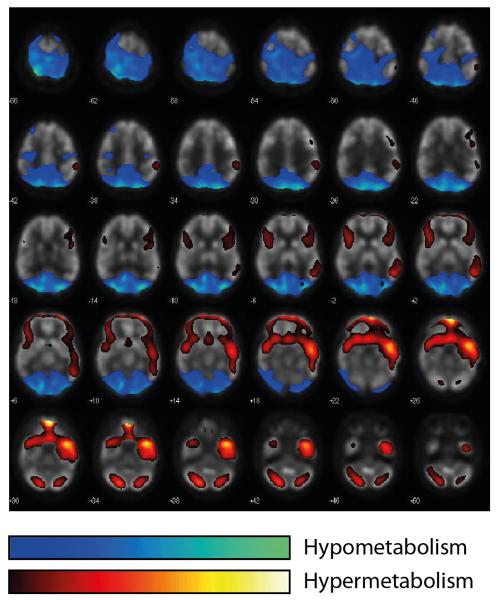
Figure I. Example of a diagnostic [18F]fluoro-2-deoxyglucose PET-CT.
As illustrated in this 23 year-old female patient after a two-month course of severe anti-NMDA-R encephalitis, these patients typically show widespread frontotemporal cortical hypermetabolism as well as bioccipital and cerebellar cortical hypometabolism [103]. For visualtization, hyper- and hypometabolism is colour-coded across the entire brain as depicted in the legend. Images are from superior (top left) to inferior (bottom right). For details on the voxel-based statistical analysis to demonstrate hyper- and hypometabolism and the corresponding cohort study see Leypoldt et al. [103]. Images courtesy of Dr. R. Buchert, Charité.

