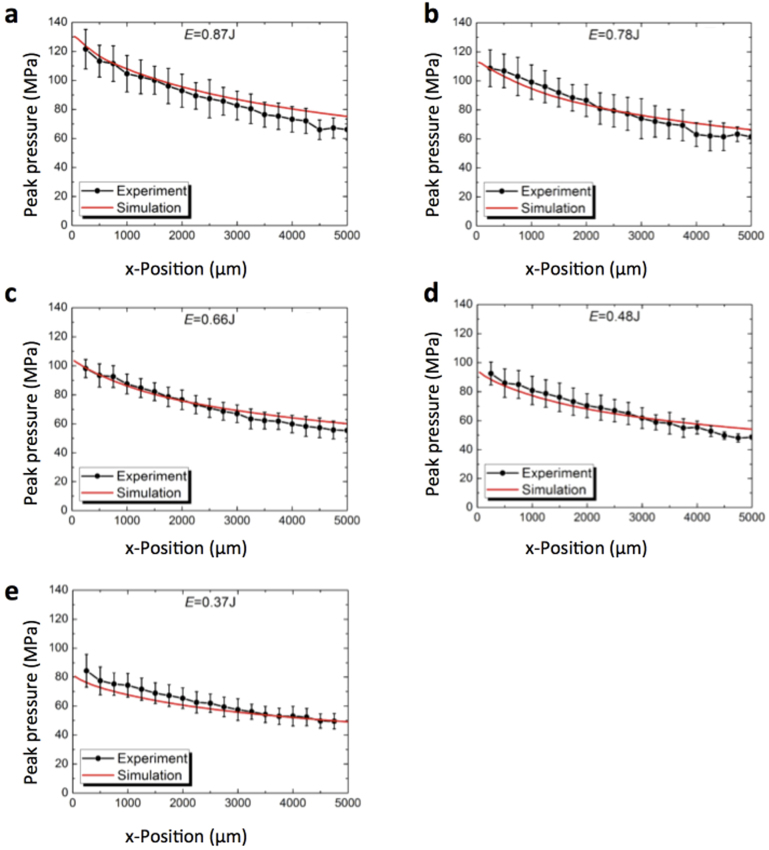
Figure 5. Peak pressures inside the well calculated from numerical simulations and comparison to hydrophone signals.
We used the velocity profiles of the well bottom (see Fig. 4a–e) as input to simulate the pressure conditions inside a well at different laser pulse energies. At constant time intervals the peak pressure and the position of the pressure wave were calculated in numerical simulations (red lines). The black dots show the peak pressure at different positions inside the well as extracted from hydrophone data (see Fig. 2). Each data point represents the average of five independent measurements at different plates; error bars display standard deviations.

