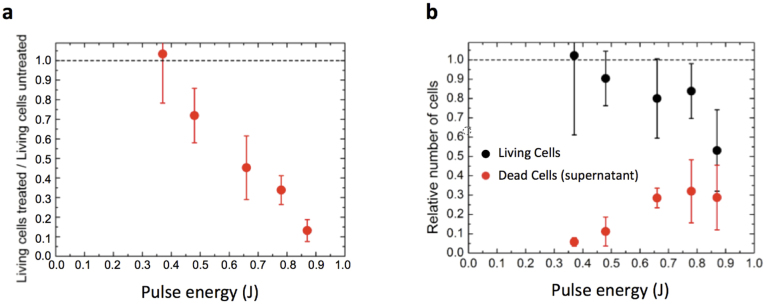
Figure 6. Analysis of cell survival after exposure to pressure wave.

Prior to pressure wave experiments, the U87 cells were grown in the prepared microtiter plate for several days (for details see Methods Section). In 15 wells the cells were treated with pressure waves while the cells in 19 wells of the same plate served as the untreated reference. Subsequently, the concentration of cells was determined with a hemocytometer by trypan blue exclusion. (a) Number of cells found in the cell layer of the treated sample divided by the number of cells found in the untreated reference,  . With the hemocytometer we also determined the numbers of dead cells in the cell layer,
  and
and  , as well as the number of living
  and dead
  cells in the supernatant. (b) Total number of cells found in the treated sample divided by the total number of cells found in the untreated sample,
  (black dots) and the relative number of dead cells found in the supernatant,
  (red dots). All data shown were recorded in 96 Well plates with PMMA cover. Data points are averages of four independent measurements, error bars are standard deviation.
