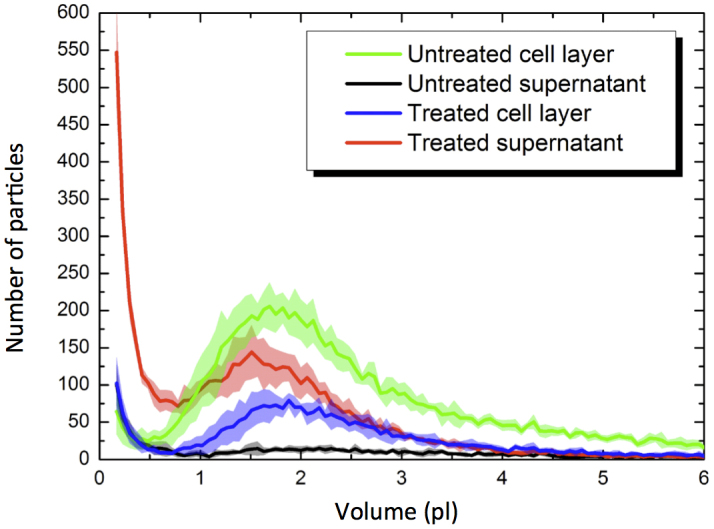
Figure 7. Volume distributions of cell layer and supernatant.

We use a Counter to determine the volume distributions of particles in the treated sample (blue and red line) and in the untreated reference (green and black line). Each curve is an average of five measurements at the same sample. The error bars (shown as lines with fill areas) are standard deviation. The pressure wave was generated at the full laser pulse energy of E = 0.87 J in a 96 well plate with PMMA cover.
