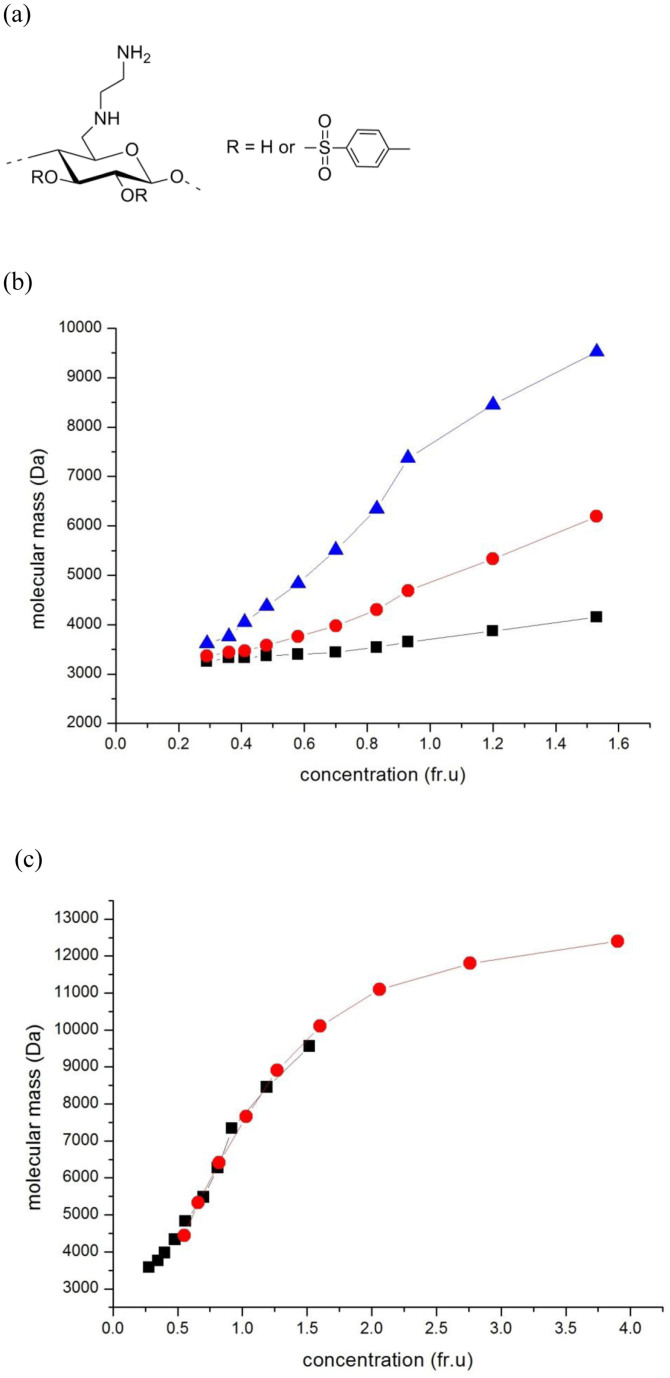
Figure 1. The 6-deoxy-6-(ω-aminoalkyl)aminocellulose AEA-1 and diagnostic ultracentrifuge plots confirming a completely reversible self-association obtained at a rotor speed of 40000 rpm and temperature 20.0°C.
(a) AEA-1 repeat unit2 with R = H or a tosyl residue (b) Plot of molecular mass change with concentration showing a reversible self-association. The plot is of the number, weight and z-average molecular mass versus local concentration (fringe increment units) in the ultracentrifuge cell for an initial loading concentration c = 0.4 mg/ml. Black squares: n-average molecular masses; red circles, mass average molecular masses, blue triangles, z-average molecular masses. The convergence of these to a single value, the “monomer” M1 = 3250 Da as the concentration → 0 is a necessary diagnostic for a completely reversible association, as commonly seem in proteins. (c) Molecular mass (z-average) plotted against local concentration in the ultracentrifuge cell for two different loading concentrations: black squares c = 0.4 mg/ml, red circles c = 2.0 mg/ml. For a completely reversible self-association the plots should lie on the same curve, which they do, a feature seen for reversible protein association6,7,8,9 (see Supplementary Information).

