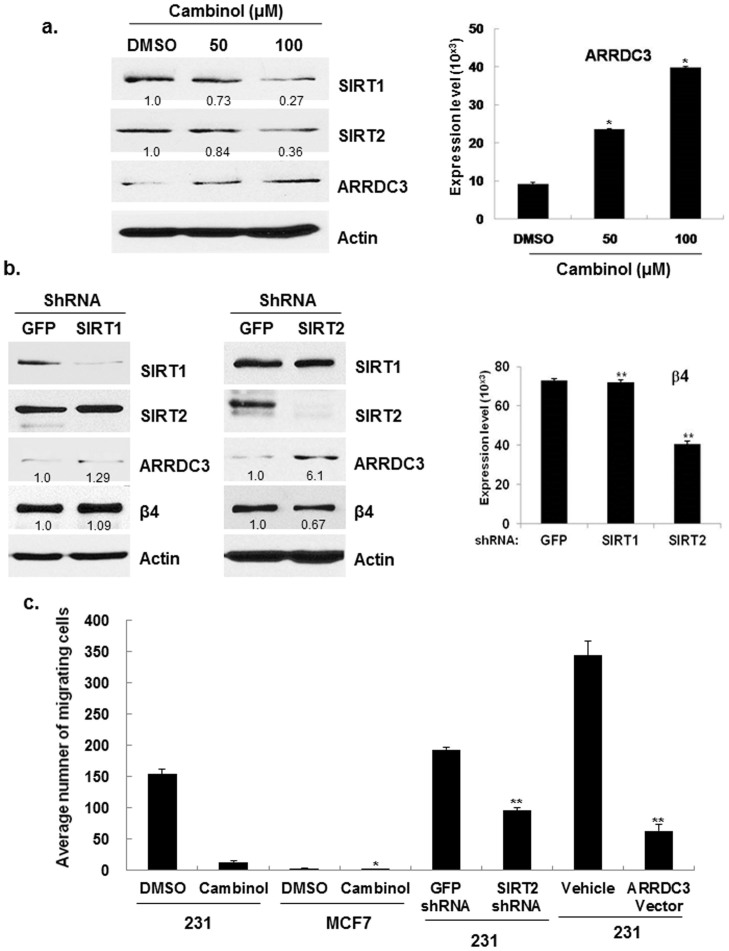
Figure 3. SIRT2 plays a major role in epigenetic silencing of ARRDC3 expression in BLBC cells.
(a) MDA-MB-231 cells were treated with DMSO (control) and SIRT1/2 inhibitor, cambinol for 24 hr at the indicated concentrations. Equal amounts of extracts from each sample were used for Western blot analysis using antibodies against SIRT1, SIRT2, ARRDC3 and β-actin (loading control). (b) Whole cell lysates were prepared from MDA-MB-231 cells expressing GFP or SIRT1 (left panel) and SIRT2 (right panel) shRNA. The expression level of SIRT1, SIRT2 b4 integrin and ARRDC3 was detected by Western blot analysis. β-actin levels were used as loading control. All results are representative of three independent experiments. The number given underneath gel image represents fold change compared with control cells. Densitometric analysis was performed to measure the relative intensity of the bands from Western blotting analysis and presented in arbitrary units (right). Statistical analysis was done using Student's t test. **, P < 0.01 comparing to the control (GFP shRNA cells). (c) The ability of cells to migrate toward 100 nM LPA was measured using a transwell cell motility assay. Migration was quantified by counting the cells that migrated to the lower surface of the membrane per square milliliter using bright-field optics. Columns, mean of three representative experiments performed in triplicate; bars, SD. The statistical analysis was done using Student's t test. *, P < 0.05; **, P < 0.01 compared with the results of the control cells.

