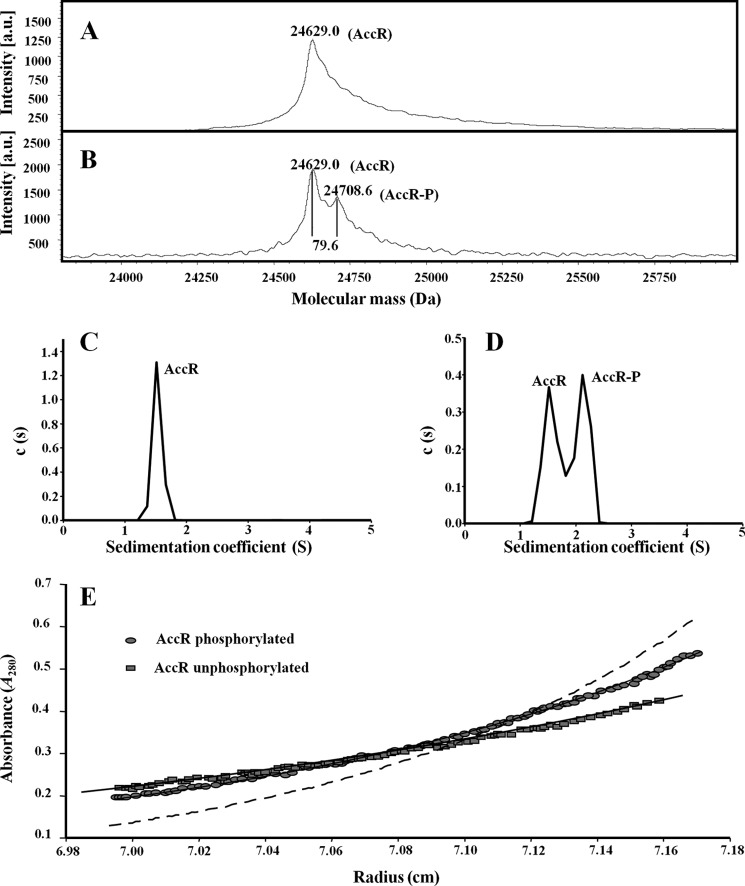
FIGURE 2.
In vitro phosphorylation of AccR provokes a monomer-to-dimer transition. A and B, mass spectrometry (MALDI-TOF) of untreated His6-AccR (A) and His6-AccR preincubated with 20 mm carbamoyl phosphate (B). Molecular masses of the peaks corresponding to unphosphorylated (AccR) and phosphorylated (AccR-P) proteins are indicated. C and D, sedimentation coefficient distribution c(s) corresponding to 10 μm untreated His6-AccR (C) and carbamoyl phosphate-treated His6-AccR (D) are represented in relation to the sedimentation coefficient (S). The peaks corresponding to the AccR and AccR-P species are indicated. The s value of the proteins did not change significantly with protein concentration over the range examined (5–40 μm). E, sedimentation equilibrium data of untreated (squares) and carbamoyl phosphate-treated His6-AccR (circles). Best fit analysis assuming a theoretical protein monomer (solid line) or dimer (dashed line) is also shown.

