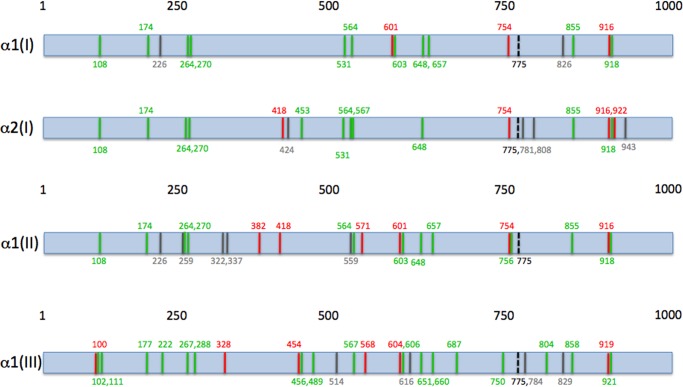
FIGURE 6.
Schematic representation of α1(I), α2(I), α1(II), and α1(III) collagen chains where potential MMP cleavage sites are indicated by gray lines, MMP cleavage sites are indicated by black dashed lines, Lys-Gly-(Asp/Glu) sites are indicated by green lines, and Gly-(Asp/Glu)-Lys sites are indicated by red lines. Numbering begins at the N terminus of the triple-helical region of each collagen. The distance between motifs and cleavage sites are not to scale.

