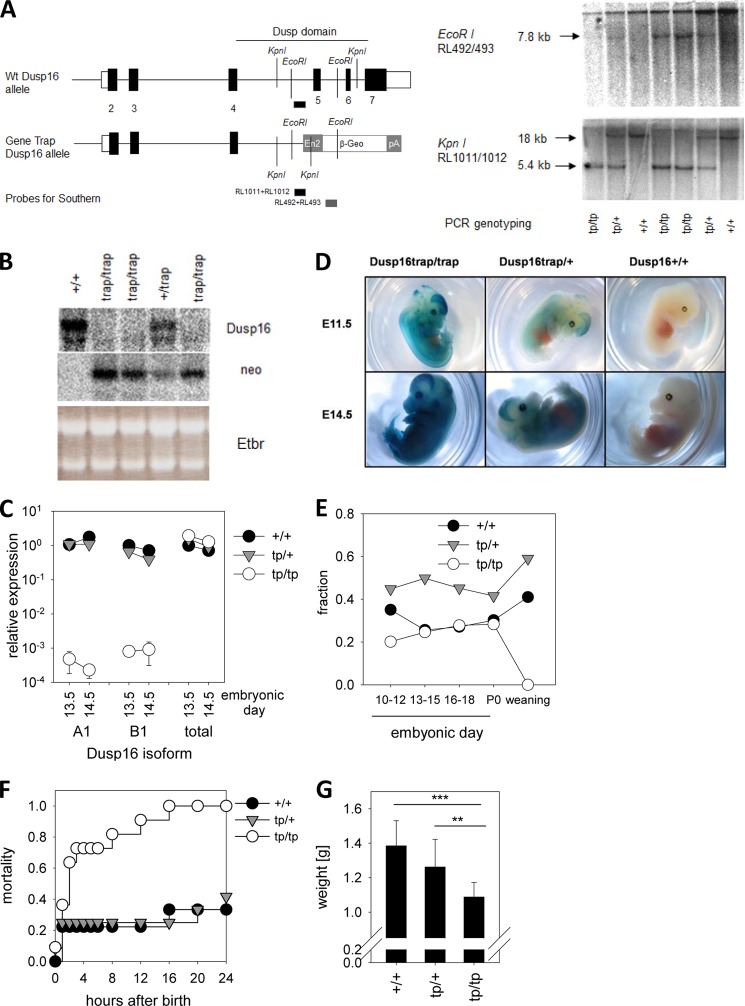
FIGURE 2.
Generation of Dusp16 gene trap mice and perinatal lethality. A, schematic overview of Dusp16 locus with β-Geo trap in intron 4 (left panel). The KpnI and EcoRI sites and the position of the probes are indicated. Southern blots of KpnI- and EcoRI-digested DNA from embryos obtained after heterozygote matings are shown in the right panel. In the KpnI blot, the 5.4-kb band stems from the gene trap allele, and the 18-kb band stems from WT. In the EcoRI blot, the 7.8-kb band stems from the gene trap allele, and the high molecular weight signal is due to nonspecific hybridization of the β-Geo probe to undigested DNA. Results of PCR genotyping are indicated. B, Northern blot analysis of Dusp16 mRNA expression in Dusp16 gene trap embryos. Total RNA prepared from E10.5 embryos was analyzed by Northern blot using probes for Dusp16 (3′ of intron 4) and the β-Geo cassette. Ribosomal RNA bands in ethidium bromide (Etbr)-stained gel indicate equal loading. C, qRT-PCR of embryo RNA analyzed with primers specific for A1, B1 (see Fig. 1A), or total Dusp16 (binding in exons 3 and 4, therefore also amplifying the Dusp16-β-Geo mRNA). Shown are mean and S.D. (error bars) of two embryos per genotype. D, X-Gal staining of whole embryos taken at E11.5 and E14.5. E, frequency of Dusp16 genotypes at different embryonic and postnatal ages. The total number of mice was 134 (E10–E12), 496 (E13–E15), 155 (E16–E18), 53 (P0), and 500 (weaning). F, neonatal lethality of Dusp16tp/tp mice. The total number of mice for each genotype in the analysis was nine (+/+), 12 (tp/+), and 11 (tp/tp). G, reduced birth weight of Dusp16tp/tp mice. Shown are mean and S.D. (error bars) and p value of Student's t test (** indicates p < 0.01 and *** indicates p < 0.001). The difference between Dusp16trap/+ and Dusp16+/+ was not significant.

