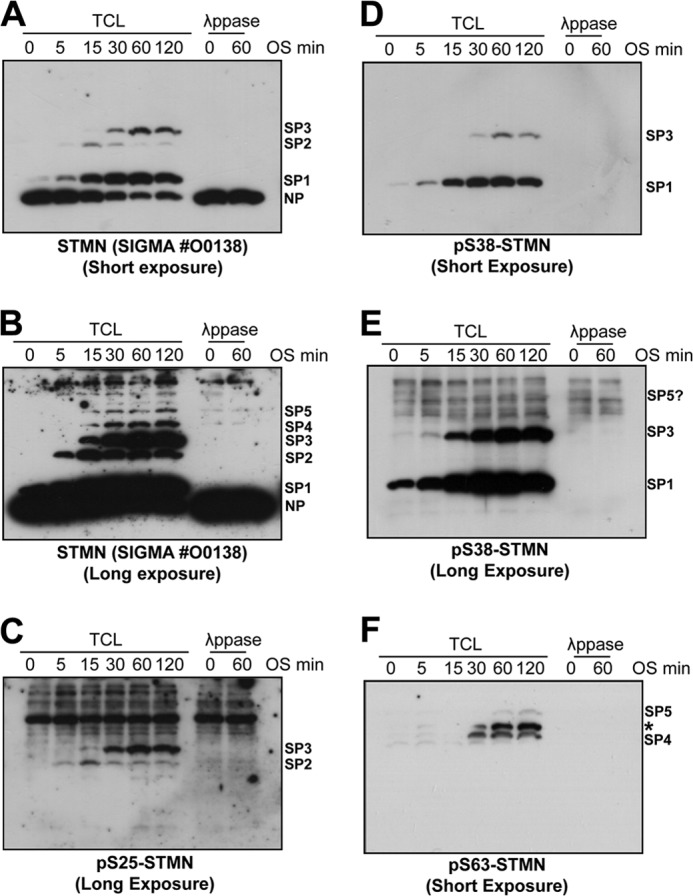
FIGURE 5.

Phos-tag mobility shift analysis of STMN phospho-isoforms induced by hyperosmotic stress. A, PC12 cells were stimulated with sorbitol (0.5 m) for 0–120 min. Total cell protein lysates (TCL) were prepared and resolved on Phos-tag gels before immunoblotting for STMN (#O0138, Sigma). λ-Phosphatase (λppase) treatment of lysates confirmed the phosphorylation status of bands with reduced mobility in response to OS treatment. B, the chemiluminescence signal from STMN blot in A was imaged for extended duration (long exposure) to a reveal lower abundance phospho-STMN bands. Stress-induced, λppase-sensitive bands represent distinct STMN phospho-isoforms, which are annotated as (SP1–SP5). Non-phosphorylated STMN was annotated as NP. C, protein lysates in A were blotted for STMN Ser-25 phosphorylation. D, lysates were blotted for STMN Ser-38 phosphorylation. E, a long exposure of the blot depicted in D. F, PC12 lysates were blotted for STMN Ser-63 phosphorylation.
