
FIGURE 1.
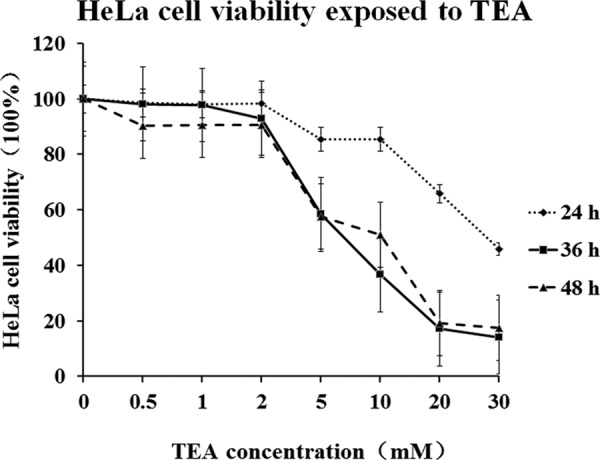
Dose-response curve between TEA concentration and cell viability of HeLa cells. Cells were treated with different concentrations of TEA for 24, 36, and 48 h. Cell viability rates were determined by using MTT assay. The results are expressed as the percentage of the viability rate of control cells. All values are represented as the means ± S.D. of three independent experiments.