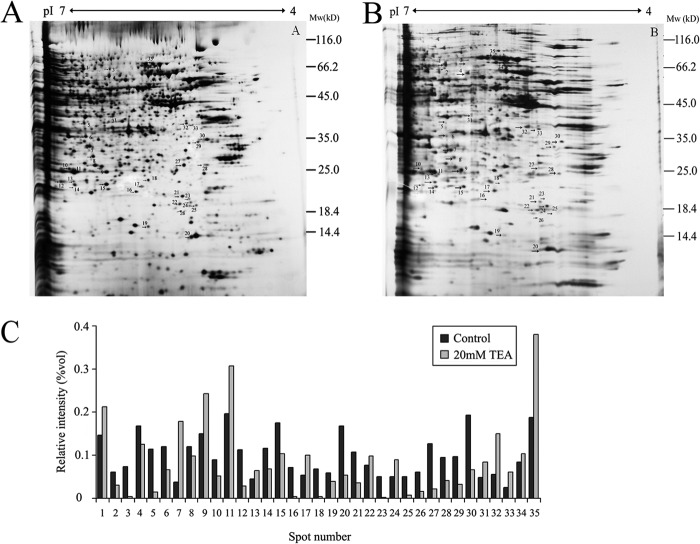
FIGURE 5.
Representative two-dimensional electrophoresis maps indicating protein spots that had significant change after 20 mm TEA exposure in HeLa cells. Whole cell lysate proteins (150 μg) were separated by two-dimensional electrophoresis and visualized using silver staining. Arrows indicate the proteins with a significantly modified expression level after TEA treatment. A, control; B, 20 mm TEA. C, relative quantification of the differential expressed proteins.

