
FIGURE 6.
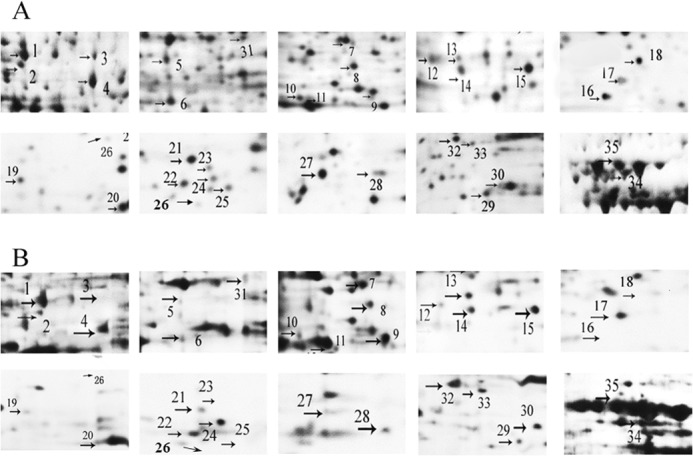
Magnified images of significantly different changed protein spots between the control and TEA-treated groups. A, differential proteins found in control group. B, differential proteins found in the TEA group.
Official websites use .gov
A
.gov website belongs to an official
government organization in the United States.
Secure .gov websites use HTTPS
A lock (
) or https:// means you've safely
connected to the .gov website. Share sensitive
information only on official, secure websites.
Magnified images of significantly different changed protein spots between the control and TEA-treated groups. A, differential proteins found in control group. B, differential proteins found in the TEA group.