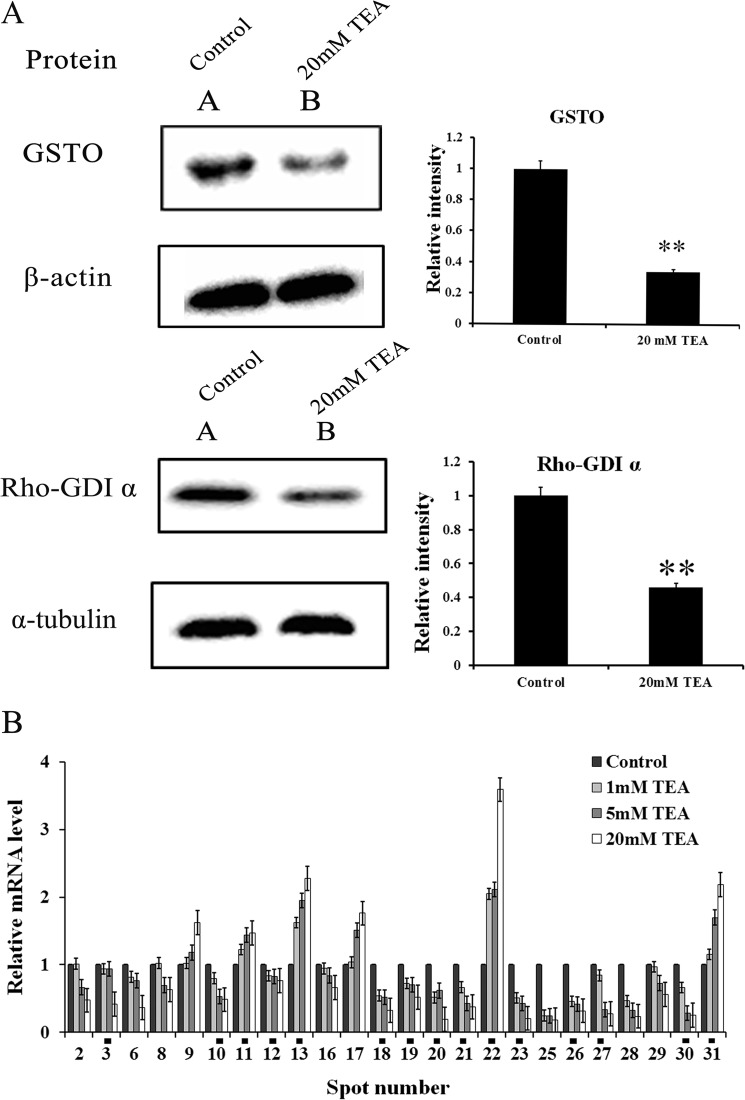
FIGURE 8.
Western blotting and RT-qPCR analysis of representative proteins and their corresponding mRNAs identified by two-dimensional electrophoresis gel. A, Western blotting analysis of GSTO1 and Rho-GDIα expression levels in the HeLa cell. Left panel, 45 μg of protein was loaded onto a 12% SDS-PAGE and probed with antibody against GSTO and Rho-GDIα. β-Actin and α-tubulin were also measured as the loading control and used for data normalization. Right panel, the quantification of the signal has been analyzed with densitometric scanning. All values are represented as the means ± S.D. of three independent experiments. * represents p < 0.05; ** represents p < 0.01. B, RT-qPCR analysis of mRNA level in the HeLa cell. RT-qPCR was performed on cDNA using gene specific primers. Relative quantification of each gene expression level was normalized according to the β-actin gene expression. The PCR data of treatments was calibrated to the control values (control = 1). All the spots show significant difference (p < 0.05) in mRNA expression levels where the TEA concentrations are set at 20 and 5 mm. Spot numbers labeled with black squares are expressed as significantly different between control and TEA treated groups (all in 1, 5, and 20 mm).

