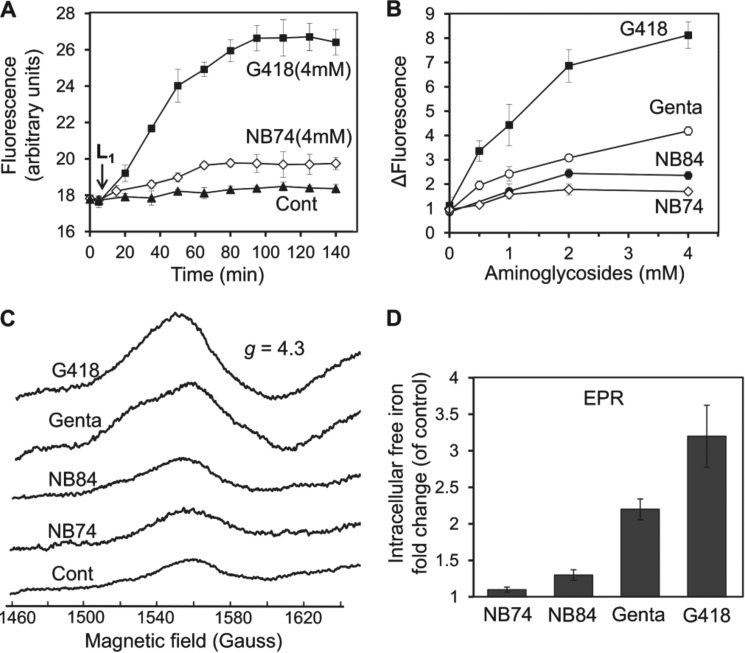
FIGURE 6.
Effect of AGs on intracellular free iron formation monitored by fluorescence and by EPR spectroscopy. A, HeLa cells were incubated with different AGs as indicated for 5 h, followed by addition of the florescence probe RPA (1 μm). Fluorescence was monitored at 543/584 nm, and after ∼10 min of base-line stabilization, Deferiprone (L1, 200 μm) was added. The time course was monitored for 140 min at 543/585 nm. The data represent means ± S.D., n = 3/point. B, dose-response effects of AGs at concentrations as indicated. The experiments were performed as in A, and the differences of fluorescence relative to untreated cells (ΔFluorescence) at indicated concentration of AG after 120 min are plotted as a function of AG concentration. The data represent means ± S.D., n = 3/point. C, iron EPR signals (g = 4.3) from whole HeLa cells. HeLa cells were incubated with different AGs (4 mm) for 5 h. The samples were incubated with DFO (20 mm) for 10 min and then frozen in liquid nitrogen. The EPR spectra were recorded at 150 K as described under “Experimental Procedures.” D, the data from C are presented as intracellular free iron fold change in exposure to different AGs as indicated versus untreated cells (control). The data represent means ± S.D., n = 3/point. Cont, control; Gent, gentamicin.

