
FIGURE 7.
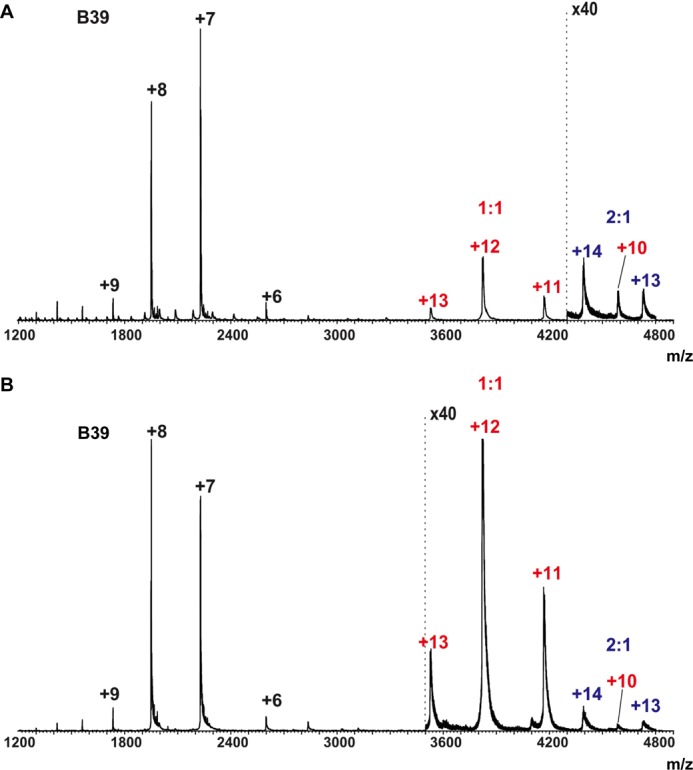
ESI mass spectra acquired for aqueous ammonium acetate (50 mm) solutions of TcdB-B3C·B39 VHH at 1:2 and 1:4 stoichiometric ratios. A, TcdB-B3C (2 μm) and B39 VHH (4 μm). B, TcdB-B3C (2 μm) and B39 VHH (8 μm). The annotations are colored according to the type of complex: VHH monomers (black), 1:1 VHH·TcdB-B3C complexes (red), and 2:1 VHH·TcdB-B3C complexes (blue).