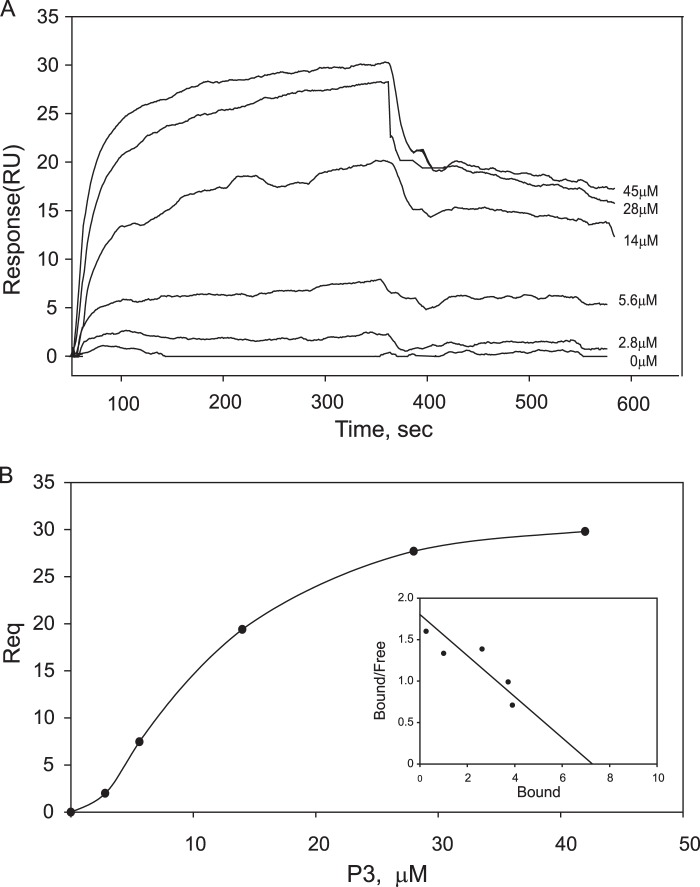
FIGURE 1.
The interaction of αIIbβ3 with the P3 peptide analyzed by SPR. A, representative profiles of the SPR responses for P3 peptide concentrations ranging from 0 to 45 μm binding to purified αIIbβ3 coupled onto a CM5 sensor chip. RU, response units. B, saturable binding curve and Scatchard plot (inset) of P3 binding to αIIbβ3. Req is the response at equilibrium. The abscissa in the Scatchard plot is the ratio of the number of P3 molecules bound per molecule of αIIbβ3. The ratio of bound to free peptide is given on the ordinate.

