
FIGURE 4.
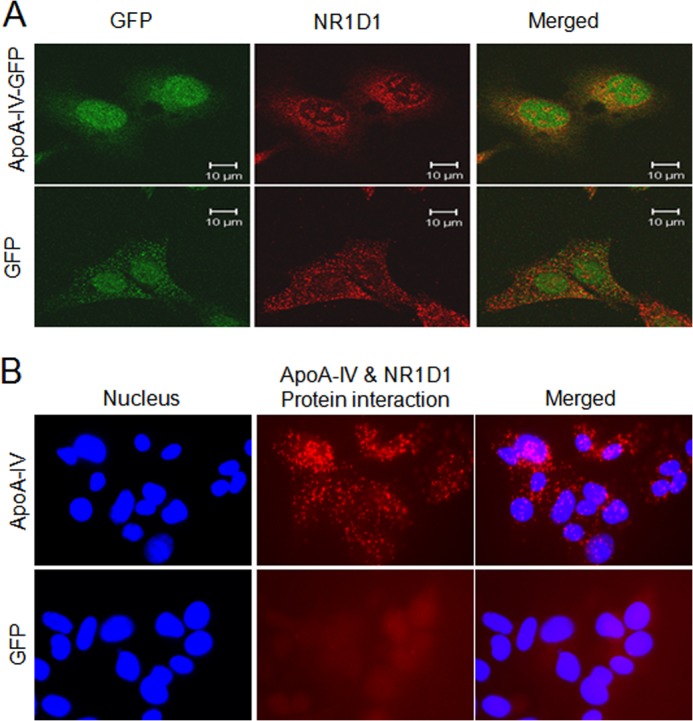
Subcellular colocalization and interaction between apoA-IV and NR1D1. A, the uptake of apoA-IV protein and subcellular colocalization with NR1D1 shown by immunofluorescence. Red represents NR1D1, and green represents r-h-apoA-IV-GFP or GFP as a negative control. B. the interaction between apoA-IV and NR1D1 detected by in situ proximity ligation assay. The interaction was visualized as red fluorescent spots. The cells were counterstained with DAPI (blue) to visualize the nuclei. This figure is a representative slide from three independent experiments.