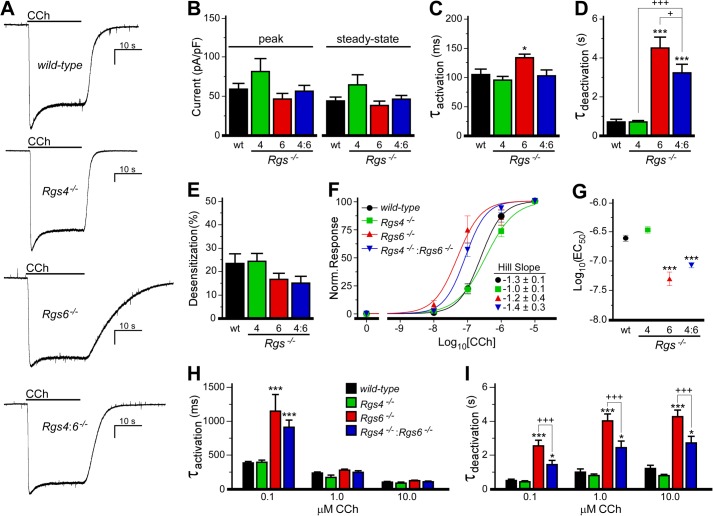
FIGURE 3.
Impact of RGS ablation on M2R-IKACh signaling in SAN cells. A, IKACh currents evoked by CCh (10 μm) in SAN cells from wild-type and Rgs−/− mice. Peaks were normalized to allow for comparison of deactivation kinetics. Scale bars = 10 s/400 pA. B, no impact of genotype on peak (F3,36 = 2.0, p = 0.13) or steady-state (F3,36 = 2.2, p = 0.10) current densities was observed (n = 8–16/genotype). pF, picofarads. C and D, a significant impact of genotype was observed for activation (F3,35 = 5.0, p < 0.01) and deactivation (F3,36 = 29.1, p < 0.001) kinetics of the CCh-induced current in wild-type and Rgs−/− SAN cells. E, there was no impact of genotype on the acute desensitization of the CCh-induced IKACh current (F3,36 = 1.3, p = 0.29). F, concentration-response curves for CCh-induced IKACh activation (steady-state current amplitudes normalized to response measured with 10 μm CCh) in wild-type and Rgs−/− mice (n = 6–8/group). Hill coefficients for each curve are listed. No significant impact of genotype was observed for Hill coefficients (F3,151 = 0.4, p = 0.8). G, EC50 values calculated from concentration-response curves shown in F (F3,151 = 24.8, p < 0.0001). H and I, activation and deactivation kinetics of the CCh-induced currents in wild-type and Rgs−/− SAN cells. An interaction of genotype and dose was observed for activation kinetics (F6,95 = 7.4, p < 0.001) but not deactivation kinetics (F6,95 = 1.5, p = 0.18). However, a significant impact of group on deactivation kinetics was observed for both genotype (F3,95 = 66.2, p < 0.001) and concentration (F2,95 = 15.3, p < 0.001), so within-concentration comparisons were performed by one-way ANOVA. * and ***, p < 0.05 and 0.001, respectively, versus wild-type mice; + and +++, p < 0.05 and 0.001 respectively.

