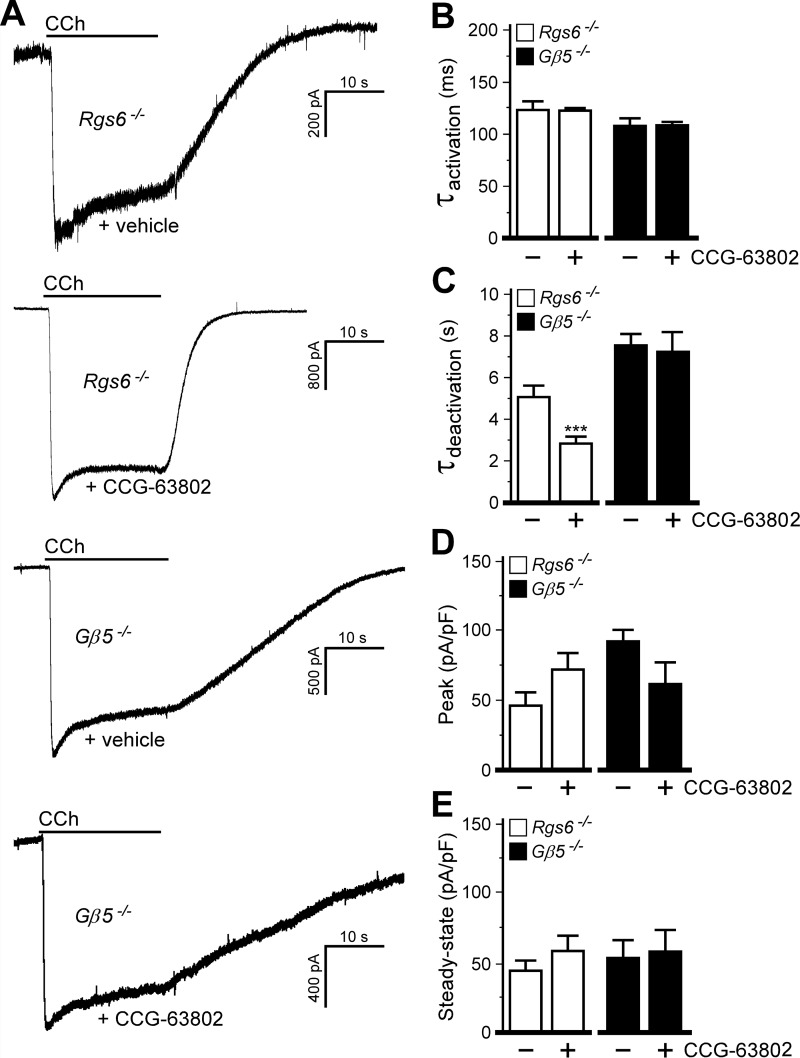
FIGURE 4.
Influence of another R7 RGS protein revealed by RGS4 ablation. A, IKACh currents evoked by CCh (10 μm) in Rgs6−/− and Gβ5−/− SAN cells treated with vehicle or CCG-63802 (50 μm, delivered via the pipette). Peak currents were normalized for comparison. B, activation kinetics of the CCh-induced current in Rgs6−/− (t14 = 0.1, p = 0.9) or Gβ5−/− (t8 = 0.2, p = 1.0) SAN cells. C, deactivation kinetics of the CCh-induced current in Rgs6−/− (t18 = 3.0, p < 0.01) or Gβ5−/− (t6 = 0.3, p = 0.8) SAN cells. D, peak IKACh current densities in Rgs6−/− (t15 = 1.7, p = 0.1) or Gβ5−/− (t9 = 0.4, p = 0.7) SAN cells. pF, picofarads. E, steady-state IKACh current densities in Rgs6−/− (t16 = 1.1, p = 0.3) or Gβ5−/− (t8 = 0.2, p = 0.8) SAN cells. Note that only within-genotype comparisons were made (n = 4–12/genotype). ***, p < 0.001 versus vehicle for each genotype.

