
FIGURE 1.
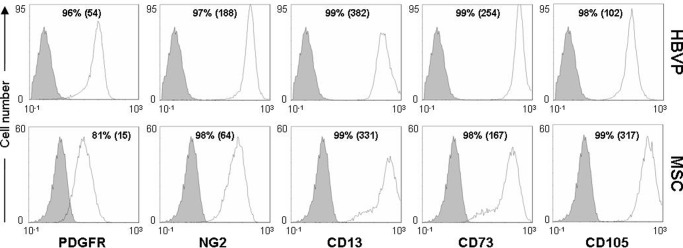
Comparative phenotypic analysis of HBVPs and MSCs. Cells were labeled with antibodies against the indicated antigens and analyzed by flow cytometry. Isotype-matched antibodies were used as control (in solid gray). Numbers indicate the percentage of positive cells together with the mean fluorescence intensity (in parentheses).