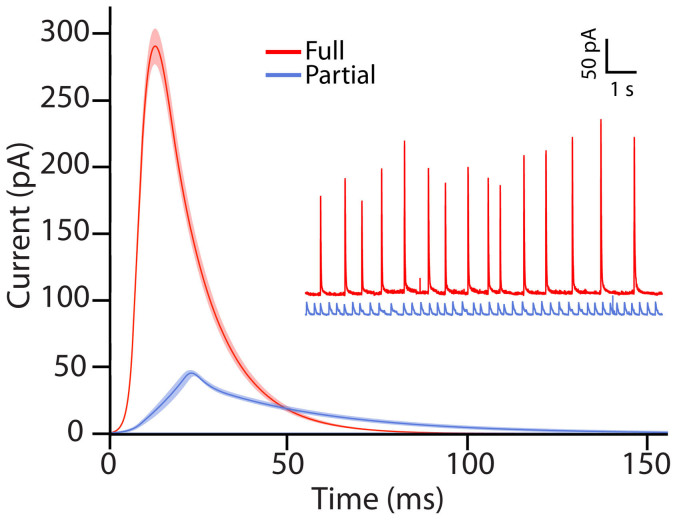
Figure 3. Representative traces and average peaks from the two modes of release.
The average amperometric peaks for release though full (red) and partial (blue) distension plotted together with SEM. The inset shows representative amperometric traces for the two modes of release. Data were collected from 11 plasma membrane vesicles where recordings from 2 of these vesicles were defined as full release and 9 of them as partial release.

