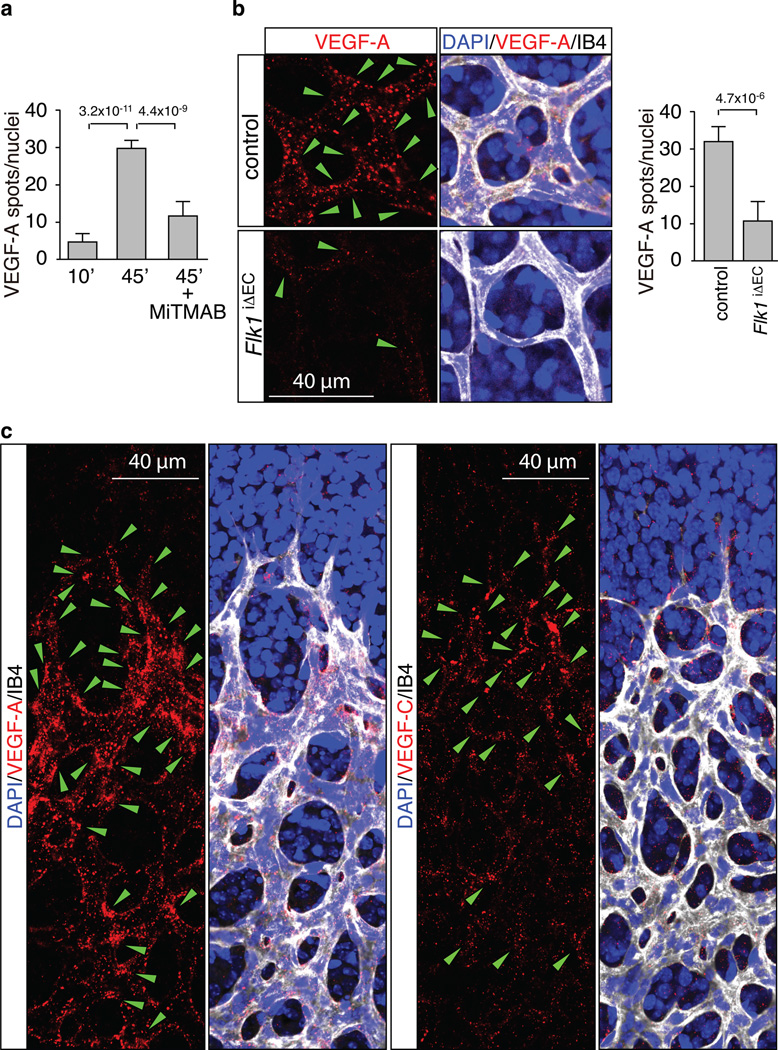
Figure 2. Spatial differences in VEGF uptake in the retina.
a, Quantitation of Alexa-labelled VEGF-A in retinal ECs at 10 and 45 min after injection. The formation of intracellular spots was blocked by MiTMAB. Data represent the means±s.d. of 6 independent experiments. P values, ANOVA.
b, VEGF-A uptake in blood vessels of FlkiΔEC mice. Green arrowheads indicate internalised Alexa dye-coupled VEGF-A (red). Cell nuclei, DAPI (blue); ECs, Isolectin B4 (IB4, white). Data represent the means±s.d. of 6 independent experiments. P values, two-tailed student t test.
c, Spatial distribution of VEGF-A or VEGF-C (red) uptake in retinal vessels. Green arrowheads indicate internalised label spots. Cell nuclei, DAPI (blue); ECs, Isolectin B4 (IB4, white).

