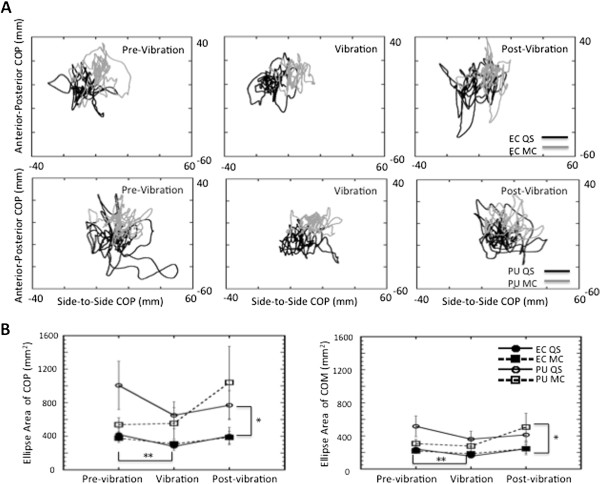
Figure 2.

Excursion of responses over time. A: AP COP versus ML COP plotted for each time period for a single subject during eyes closed (top row) and pitch up rotation of the visual field (bottom row) when standing quietly (black line) and when performing mental calculation (grey line). An ellipse was fit to these traces and area was calculated. Ellipses have been omitted for clarity. B: Average Area of COP (left) and COM (right) with standard error bars for all experimental conditions.
