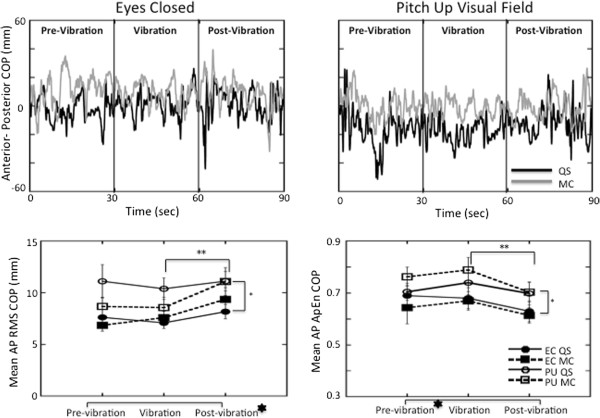
Figure 4.

Anterior-posterior responses of the COP. Top: COP in the AP plane plotted over time for a single subject during the eyes closed (left) and the pitch up visual field (right) conditions in quiet stance (black line) and when performing mental calculation (grey line). Bottom: Average RMS (left) and ApEn (right) of the COP responses with standard error bars across all subjects in the AP plane. The signs for statistical significance are the same as in Figure 3.
