
Figure 1.
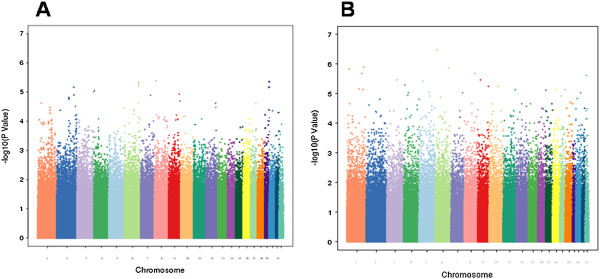
A Manhattan plot is shown for A. the combined IoP/CAMH case/control cohort, and B. the CAMH small family sample, with –log10(P-value) plotted by genomic location for chromosomes 1–22. SNPs from each chromosome are represented by different colors and ordered by physical positions.