
Figure 2.
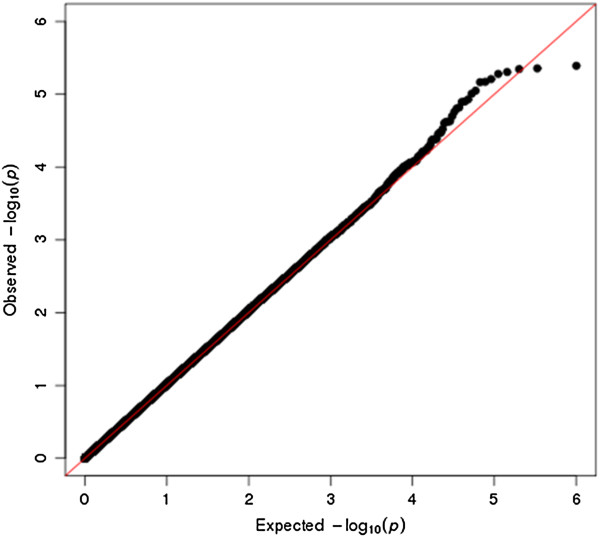
Quantile-Quantile (Q-Q) plot of p-values for the case control dataset. Note: The Q-Q plot measures deviation from the expected P-values. The diagonal (red) line represents the expected (null) distribution. The slight deviation of the observed values from expected values at the tail of the distribution is consistent with modest genetic effects.