
Figure 3.
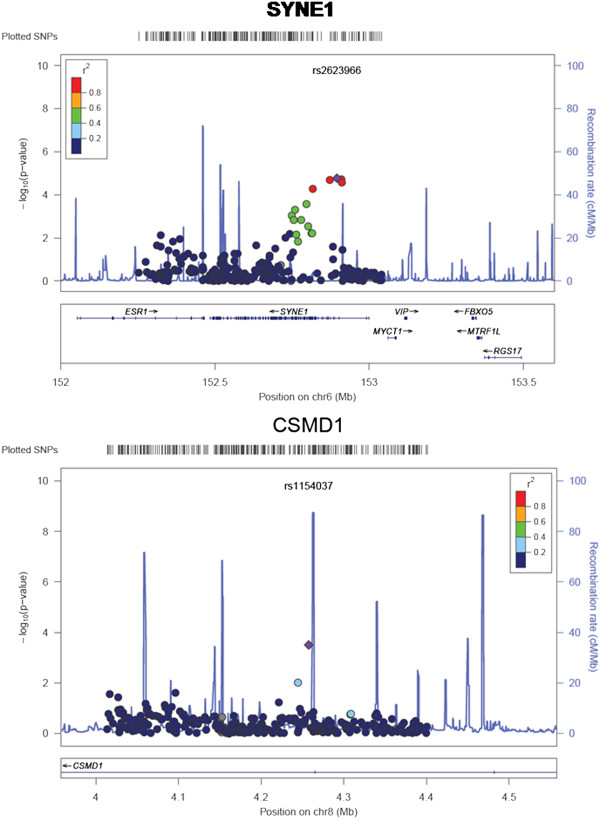
Plots for association for combined IoP/CAMH cohorts across the SYNE1, and CSMD1 loci. Probability of significance of association for SNPs passing quality control is shown as –log10 of the P-value on the left hand Y-axis. Recombination rate as estimated from HapMap (http://hapmap.ncbi.nlm.nih.gov/) is plotted in light blue. Chromosomal position is plotted according to NCBI build 36/Hg18. The SNP with the strongest evidence for association at each locus is shown as a blue diamond.Correlation of linkage disequilibrium between SNPs and the blue diamond SNP, r2, is colour-coded, red indicating stronger LD.