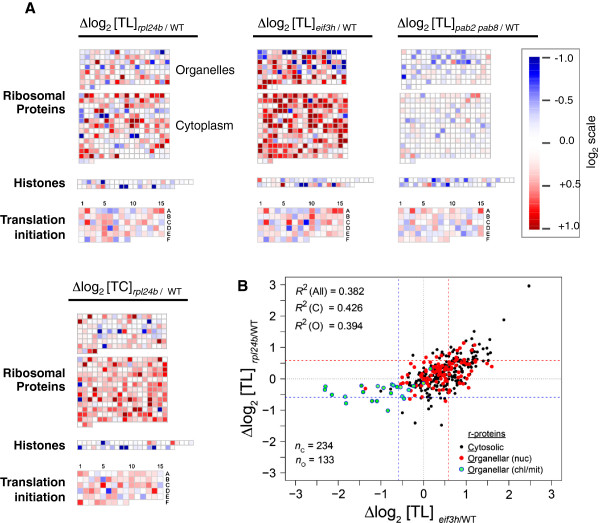
Figure 4.
Enhancement of translation of ribosomal protein mRNAs in the rpl24b mutant. (A) Changes in translation state (Δlog2 TL) were plotted onto Arabidopsis biochemical pathways and functional categories using MapMan v3.5.1R2. Each square represents a single gene, and each gene occupies equivalent positions in each set. The log-scale indicates overtranslation (red) or undertranslation (blue) in rpl24b or eif3h or pab2 pab8 compared to wild-type. Ribosome occupancy of ribosomal protein mRNAs is stimulated in rpl24b, which is enhanced in eif3h (middle). The similarity does not extend to histones, which are shown as a representative comparison group. It also does not extend to pab2 pab8. Also note that transcript levels (Δlog2 TC rpl24b/WT) for cytosolic r-proteins tend to be elevated in the rpl24b mutant. Data are for selected gene classes from all A. thaliana probe sets (genes) on the GeneChip® Arabidopsis ATH1 Genome Array (n = 22,746). (B) Scatterplot showing the translational codependence of cytosolic (black filled circles) and organellar (red and green filled circles) r-protein mRNAs on RPL24B and eIF3h. Genes encoding organellar r-protein mRNAs are further subdivided into nuclear-encoded (nuc) and chloroplast-encoded or mitochondrion-encoded (chl/mit). Pearson correlation coefficients (R2) for cytosolic (C), organellar (O) and all (All) r-protein mRNAs are indicated. Dashed lines (blue and red) represent 1.5-fold changes. The number of mRNAs (n) for each class of r-protein is also indicated.

