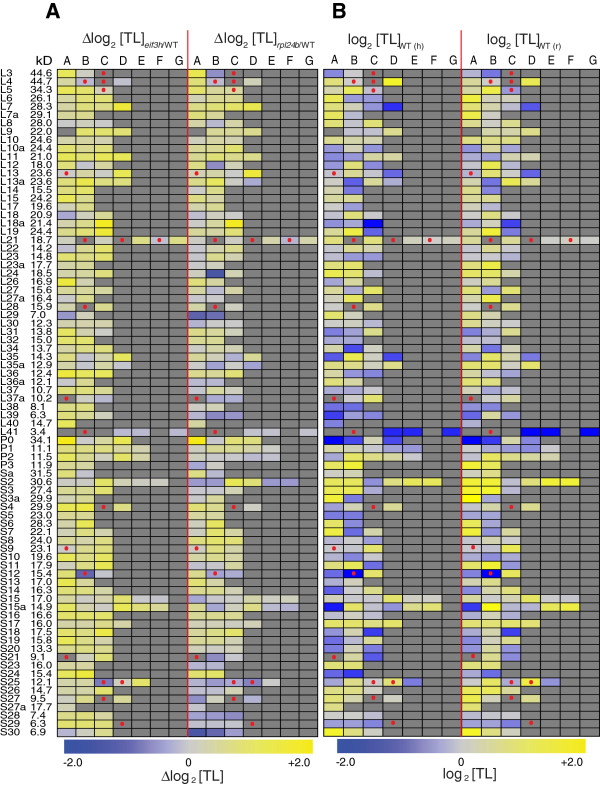
Figure 5.
Translation states of ribosomal protein paralogs. Each ribosomal protein is encoded by up to seven paralogs named A to G. The molecular weight of the protein is indicated on the left. The heatmap in (B) shows absolute ribosome occupancy of the r-protein mRNA in wild-type plants, while the heatmap in (A) shows the increase (yellow) or decrease (blue) in ribosome occupancy in the rpl24b and eif3h mutants (see scale at the bottom). Gray color indicates that the gene does not exist or is not represented on the array. Dots indicate pseudogenes and incomplete open reading frames (ORFs). In (B), the left and right panels show average ribosome occupancy (Translation State) from two replicates of the wild-type control plants grown for the eif3h experiment [20] and from three replicates of the wild-type of the rpl24b experiment (this study), respectively.

